. 2020 May 22;9:e53226. doi: 10.7554/eLife.53226

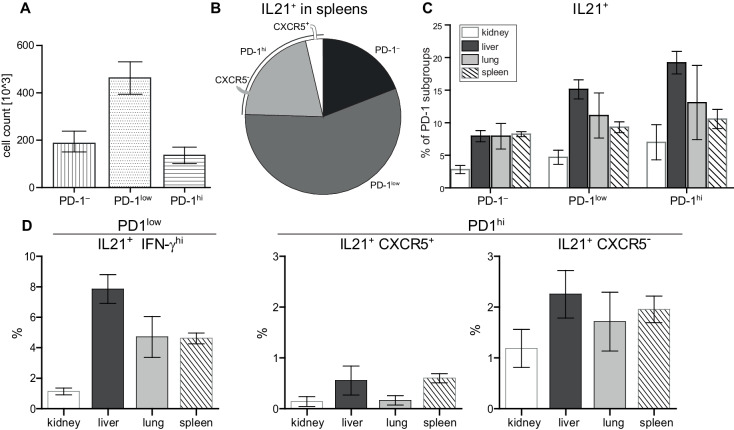
Figure 5. Super-functional T cells in peripheral organs exceed extrafollicular T cells and Tph cells in terms of frequency.

Figure 5.

(A) Absolute numbers of PD-1 subsets in spleens. (B) Frequency of IL-21 producers in spleens. (C, D) Frequency of IL-21 producers in terms of localization and in terms of PD-1 subset. Data represent two independent experiments with n = 4 mice per organ. Data are presented as the mean ± s.e.m.

Figure 5—source data 1. Figure 5A: Frequencies of PD-1 subpopulation.
Data represent two independent experiments with n = 4 mice per organ.
Figure 5—source data 2. Figure 5B: Frequencies of IL-21 producers in spleens.
Data represent two independent experiments with n = 4 mice per organ.
Figure 5—source data 3. Figure 5C: Frequencies of IL-21 producers in terms of localization and in terms of PD-1 subset.
Data represent two independent experiments with n = 4 mice per organ.
Figure 5—source data 4. Figure 5D: Frequencies of IL-21 producers in terms of localization and in terms of PD-1 subset.
Data represent two independent experiments with n = 4 mice per organ.