. 2020 May 1;9:e53560. doi: 10.7554/eLife.53560

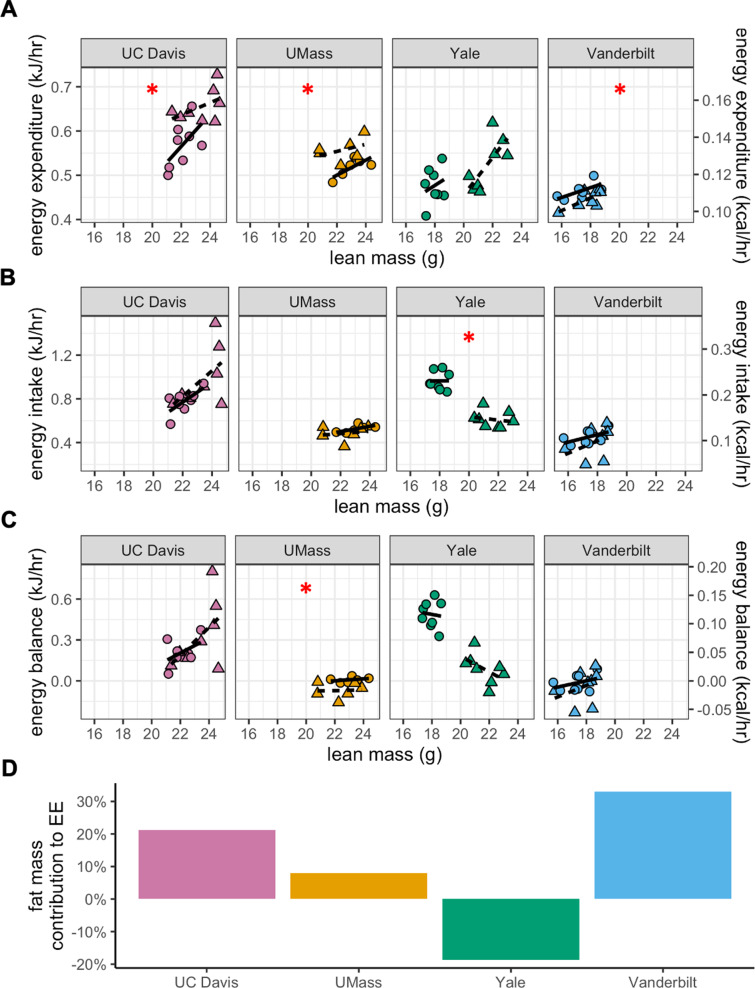
Figure 2. MMPC experiment: institutional variability in metabolic rate.

Regression plots for each of the MMPC sites vs mass (left). A regression model fitted to LFD mice for site, mass, and locomotor activity was established; the deviation from the predicted values is shown as residuals (right). EE (A–B). Energy intake (C–D). Energy balance (E–F). Time-dependent plots for the UC Davis site after 11 weeks on HFD including EE (G), RER (H), hourly energy intake (I), cumulative energy intake (J), energy balance (K), and locomotor activity (L). Values are hourly means (G–L). *, p<0.05. n = 6–8 males per group. Error bars represent SEM. Shaded regions represent the dark photoperiod from 18:00 to 6:00.

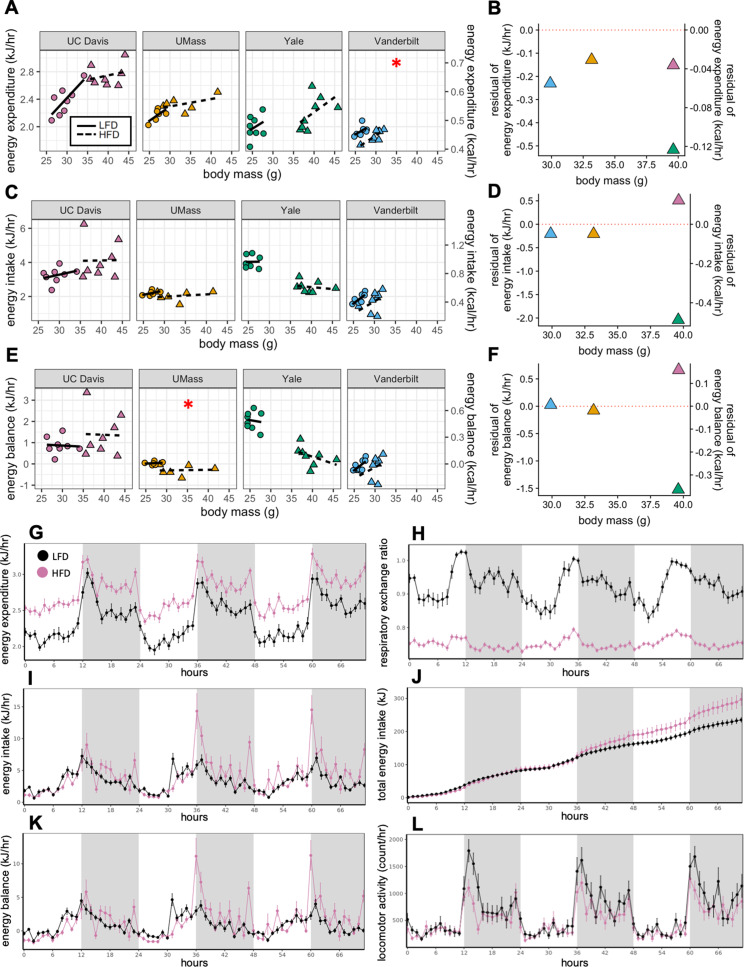
Figure 2.

Figure 2—figure supplement 1. MMPC experiment: energy balance using lean mass as a covariate.

Figure 2—figure supplement 1.

Data as in Figure 3, using the lean mass as the covariate in place of total mass. Regression plots for each of the MMPC sites vs mass. EE (A). Energy intake (B). Energy balance (C). Relative contribution of fat mass to EE for each site from a linear regression model (D). n = 6–8 males per group.
Figure 2—figure supplement 2. Body weight, energy balance and RER.

Figure 2—figure supplement 2.

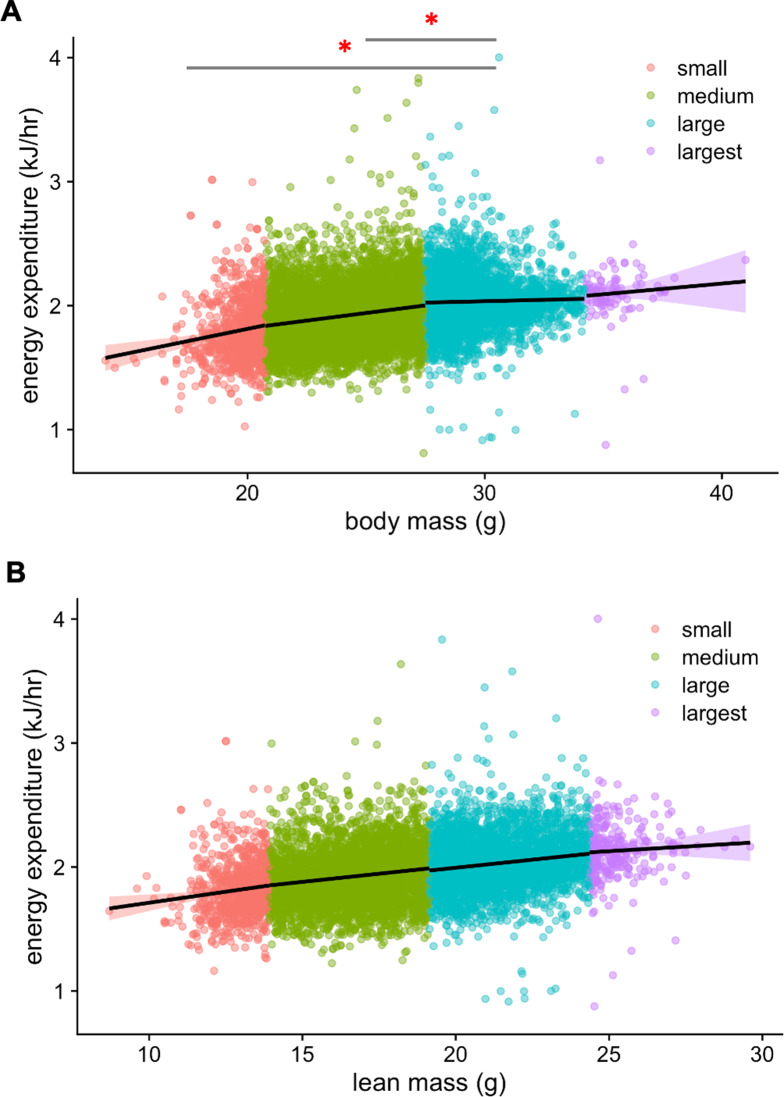
Plots of change in energy balance (Energy intake minus EE) vs change in body weight (mass at start of experiment minus mass at end of experiment). MMPC (n = 56 males) (A). IMPC (n = 3738 males and 2140 females) (B).