. 2020 May 1;9:e53560. doi: 10.7554/eLife.53560

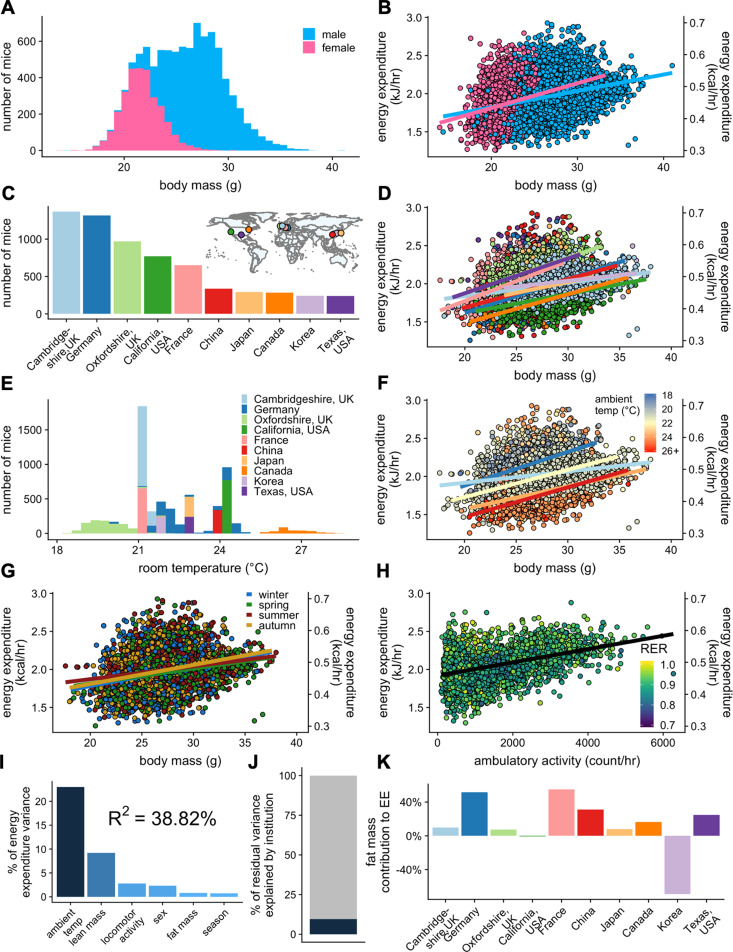
Figure 3. IMPC experiment: institutional variability of metabolic rate.

Distribution of body weights for male and female WT C57BL/6N mice from the IMPC database version 10.0 (A). Relationship of EE vs total body mass for female and male WT mice (B). The numbers of male WT mice examined at each of the 10 IMPC sites (C). Inset: geographical locations of IMPC sites. Relationship of EE vs total body mass for male WT mice at each of the 10 IMPC sites (D). Reported ambient temperatures for the experiments performed at each site (E). Relationship of EE vs total body mass in WT males for temperature (F) and season (G). Relationship of EE vs ambulatory activity in WT mice (n = 3886 males) (H). Unaccounted institutional contribution here is approximately 10% (J). The percent variation in EE explained by each of the listed factors (I). Percent contribution of fat mass to EE by site in WT males (K). n = 6469 males and 2889 females unless otherwise specified.

Figure 3—source data 1. Pairwise comparisons of slopes in regression plots of EE vs total mass.

Figure 3.

Figure 3—figure supplement 1. IMPC experiment: body weight and metabolic rate.

Figure 3—figure supplement 1.

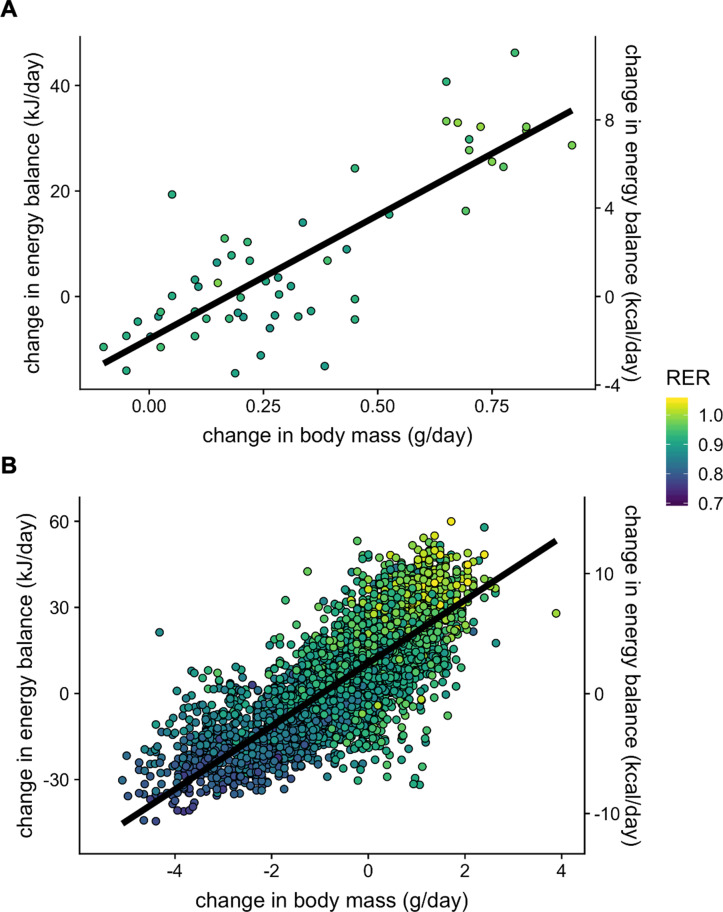
Plot of EE vs total mass for 4 body mass groups (small, 14.00–20.75 g; medium, 20.75–27.50 g; large, 27.50–34.25 g; largest, 34.25–41.00 g) (A). Relationship between the group with large masses is significant from small mass and medium mass groups. No other group relationships are significant. EE vs lean mass (small, 8.70–13.92 g; medium, 13.92–19.14 g; large, 19.14–24.36 g; largest, 24.36–29.60 g). No group relationships are significant. (B). *, p<0.05. n = 6469 males and 2889 females.
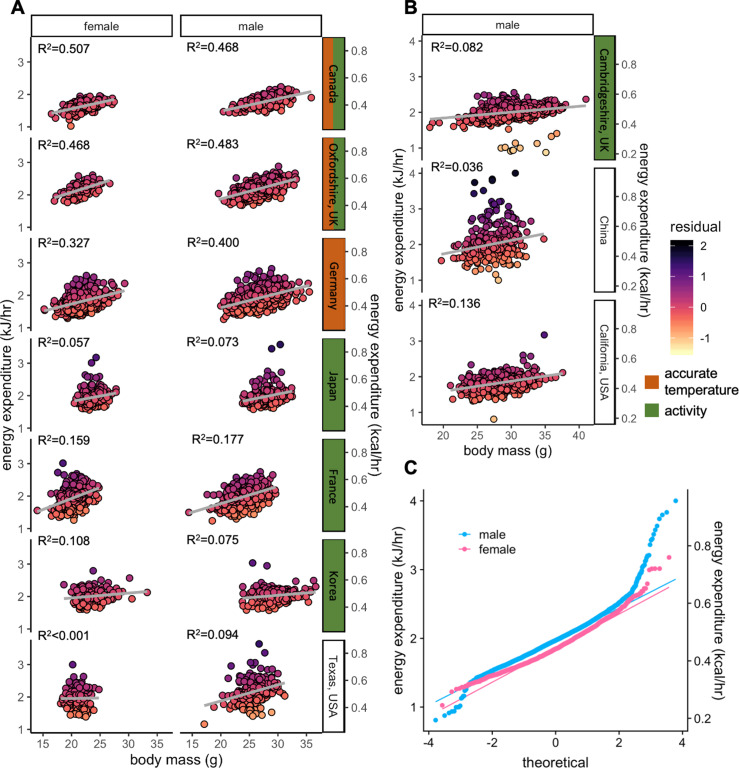
Figure 3—figure supplement 2. Variation in energy expenditure for WT female and male mice.

Figure 3—figure supplement 2.

Plots of the EE vs total mass showing the quality of the fit (R2 values) and shaded by residual values—the deviation from predicted values for each of the 9358 mice (6469 males and 2889 females). For the seven sites studying both sexes, the R2 values were similar between female and male mice (+/- 9%). Sites with accurate temperature covariate tended to have larger R2 values (A). R2 at the 3 sites reporting only data from male mice (B). A modified quantile-quantile plot of male and female mice from the 7 sites studying both sexes (C).
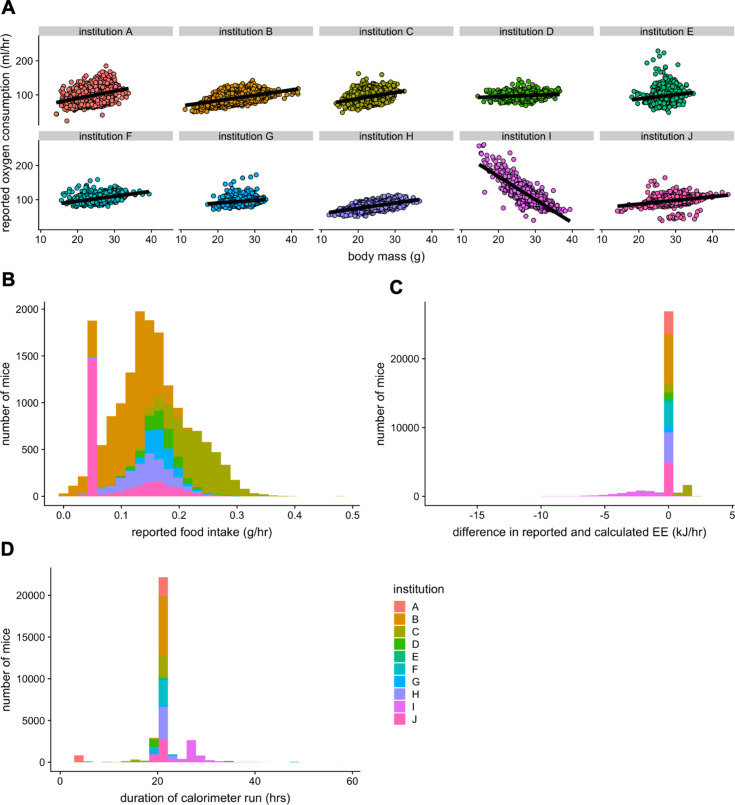
Figure 3—figure supplement 3. Irregularities in the IMPC dataset.

Figure 3—figure supplement 3.

A plot of VO2 vs total body mass for each of the 10 sites in the IMPC (A). Only one site demonstrates a negative mass effect due to a faulty calculation. Distribution of food intake among the reporting sites. The 0.05 g food intake was erroneously overrepresented (n = 10,021 males and 6818 females) (B). Two sites reported EEs calculated by a different equation from the rest of the dataset (C). Durations of calorimetry run data included in IMPC database (D). These four issues were corrected prior to analysis. n = 25,089 males and 10,725 females unless otherwise specified.