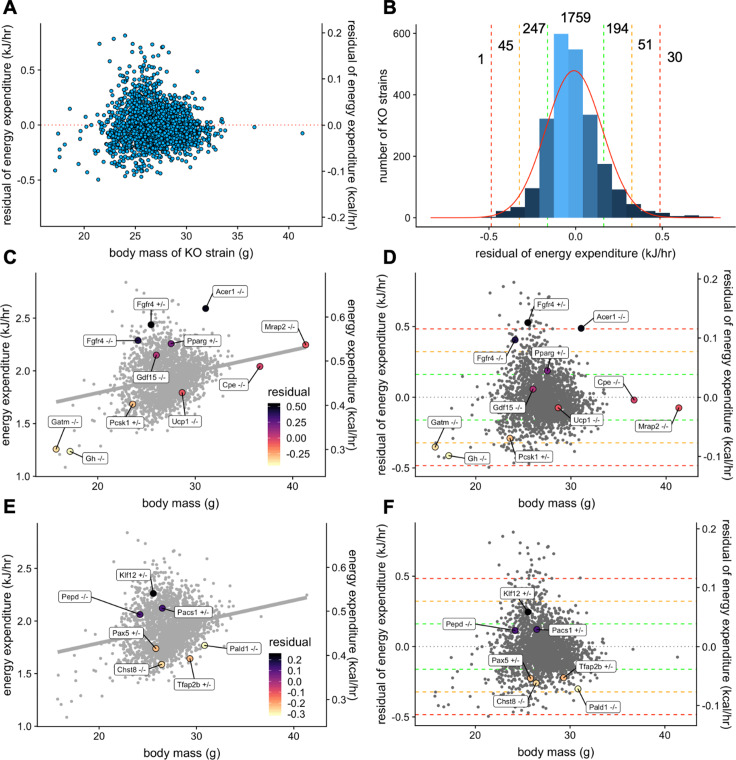
Figure 6. Genetic contribution to EE.
The residual change in EE compared to site-appropriate controls for males of 2329 strains (A). Distribution of residual changes in EE for all KO strains with the numbers of KO strains reaching 1SD (green), 2SD (orange), or 3SD (red). Regression plots of EE vs mass (C) or residual EE vs mass for mice from mouse strains with known metabolic phenotypes (D). Lines showing ranges of standard deviations in EE are overlayed. Similar plots for IMPC strains with genes identified by obesity related GWAS and having phenotypes of more than 1 standard deviation (E, F). n = 23,309 males.

