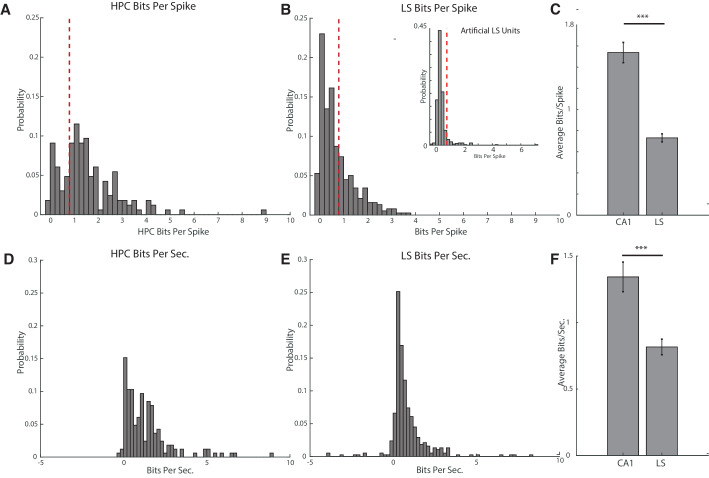
Figure 2. Hippocampal units have a higher average bits per spike and bits per second than septal units.
(A) Bits per spike of all recorded hippocampal units with an average spike rate >0.05 hz and full track coverage. A bits per spike cutoff of 0.8bits/spike is marked with a dotted line. (B) Larger graph: same as A for units in the lateral septum. Inset: bits per spike for artificially created LS units. The distribution of the bits/spike for the artificial units was highly significantly different than the distribution of bits/spike for actual units (KS test, p<10−15), and only 7.96% of artificial units had bits/spike measurements of greater than 0.8. The average bits/spike for the artificial units was 0.43, compared to an average value of 0.73 for actual units (two-tailed two sample t-test, t(818)=6.72, p<10−10). (C) Comparison of bits per spike for hippocampal and septal units. The average bits/spike of a CA1 cell is significantly higher than the average bits/spike of an LS cell. HPC mean 1.54+−1.2 bits/spike, LS mean 0.73+−0.7 bits/spike, two-tailed two sample t-test t(541)=9.42, p<0.001). Error bars represent standard error. (D) Bits per second of all recorded hippocampal units with an average spike rate >0.05 hz and full track coverage. (E) Same as D for units in the lateral septum. (F) Comparison of bits per second for hippocampal and septal units. CA1 units had a mean of 1.34+−1.4bits/sec, and LS cells had a mean 0.82+−1.1bits/sec. Units in the hippocampus had a significantly greater mean bits/sec than in the LS (two-tailed two sample t-test t(541)=4.57, p<0.001). Error bars represent standard error.


