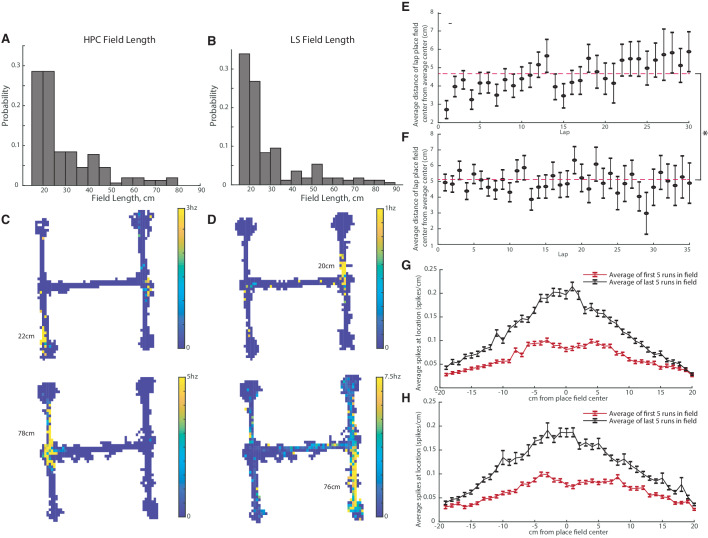
Figure 4. CA1 and LS place fields have comparable lengths and are modified with experience.
The average field lengths in CA and LS were not significantly different (two-tailed two sample t-test t(320)=-0.16, p>0.05). (A) Distribution of field lengths in the CA1. The average length of a CA1 place field was 29.1+-14.7cm. (B) Distribution of field lengths in the LS. The average length of an LS place field was 28.8+-16.6cm. (C) Example fields in the CA1. Top: example of a shorter field with a length of 22cm. Bottom: example of a longer field with a length of 78cm. (D) Example fields in the LS. Top: example of a shorter field with a length of 20cm. Bottom: example of a longer field with a length of 76cm. (E) Distance of highest HPC firing location from mean place field center during each lap. Average distance across all laps is marked with a dotted line The average distance from the field center in lap one is slightly but significantly different than the average field distance from the center in lap 30 (two-tailed two sample t-test t(177)=-2.7, p<0.01). (F) Distance of highest LS firing location from mean place field center during each lap. The average distance from the field center in lap one was not significantly different than the average field distance from the center in lap 30 (two-tailed two sample t-test t(207)=0.2, p>0.05). On average, compared to the LS, the HPC is slightly more accurate on the first lap as well as across all laps. (On the first lap, HPC has a mean distance of 2.7cm versus 4.9cm for the LS, two-tailed two sample t-test t(319)=-3.1, p<0.005. Across all laps, mean distance of 4.70cm for the HPC versus 5.12cm for the LS, two-tailed two sample t-test t(6792)=-2.5, p<0.05). (G) HPC spiking frequency per cm as a function of location around the place field center. The average spiking rate/cm of the first five runs through the field is marked in red, and the last five runs in black. Error bars represent standard error. The difference between the first and last run averages was significant for all cm values except +18cm and +20cm (all two-tailed two sample t-test). (H) Same as G but for the LS. The difference between the first and last run averages was significant for all cm values except -18cm (all two-tailed two sample t-test).

