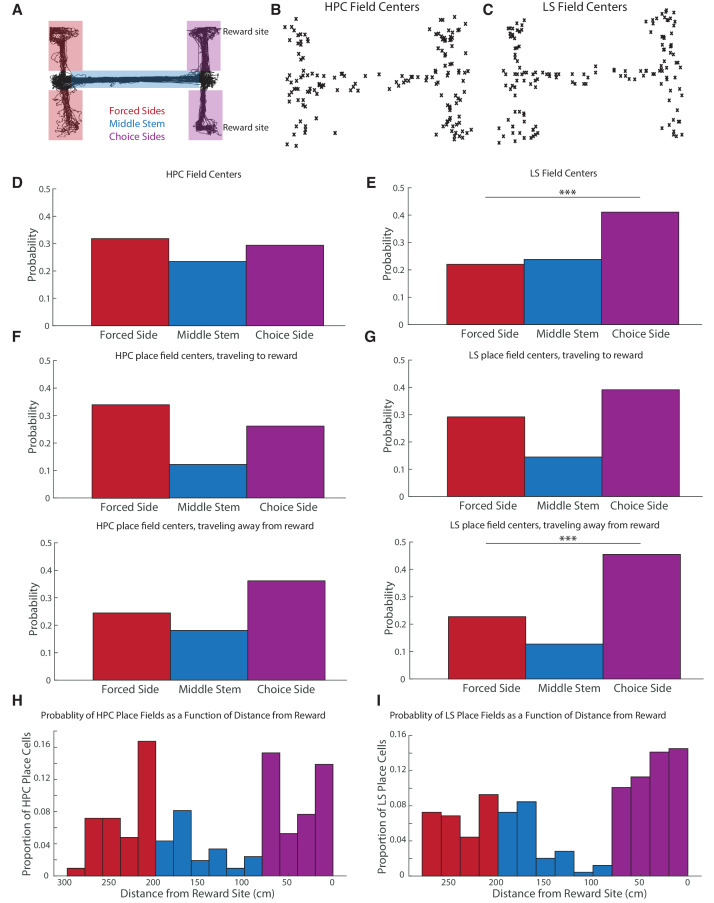
Figure 6. CA1 and LS fields have different location distributions, with LS place fields more biased toward reward locations.
The distribution of place fields is significantly different between the hippocampus and the lateral septum (Pearson’s chi2 test, X2=12.7, p<0.05). (A) Schematic showing where the maze is split to identify place field location. (B) Scatter plot of HPC field centers (C) Scatter plot of LS field centers D. Distribution of HPC field centers. In CA1, place fields are no more likely to be on the choice side of the maze than the forced side (two-tailed two sample t-test t(364) = -2.34, p>0.05) (E) Distribution of LS field centers. There were significantly more fields in the choice arms compared to the forced arms (two-tailed two sample t-test t(334)=-3.8, p<0.001). The LS also has about 1.4 times, proportionally, more place fields in the choice side than the HPC does (41.1% of fields in the LS, versus 29.2% of fields in the HPC, two-tailed two sample t-test t(320) = -2.23, p<0.05). (F) Distribution of HPC place field centers by direction of travel. Top: traveling to reward. Bottom: traveling away from reward. (G) Distribution of HPC place field centers by direction of travel. Top: traveling to reward. Bottom: traveling away from reward. The LS had significantly more place fields on the choice side than the forced side in both travel directions, with the difference highly pronounced travelling away from reward (travelling toward reward two-tailed two sample t-test t(254)=1.82 p<0.10, travelling away from reward two-tailed two sample t-test t(218)=3.8 p<0.001). The distribution of place fields in the choice side was also significantly different based on the animal’s travel (one-tailed two sample t-test t(102)=-2.15, p<0.05). (H) The probability of finding a hippocampal place field as a function of distance from rewarded locations. As above, red represents the forced side of the maze, blue the middle arm, and purple the choice side. Note that the divisions between the three segments of the maze are not exactly represented in the histogram due to binning. (I) Same as H but for the LS.


