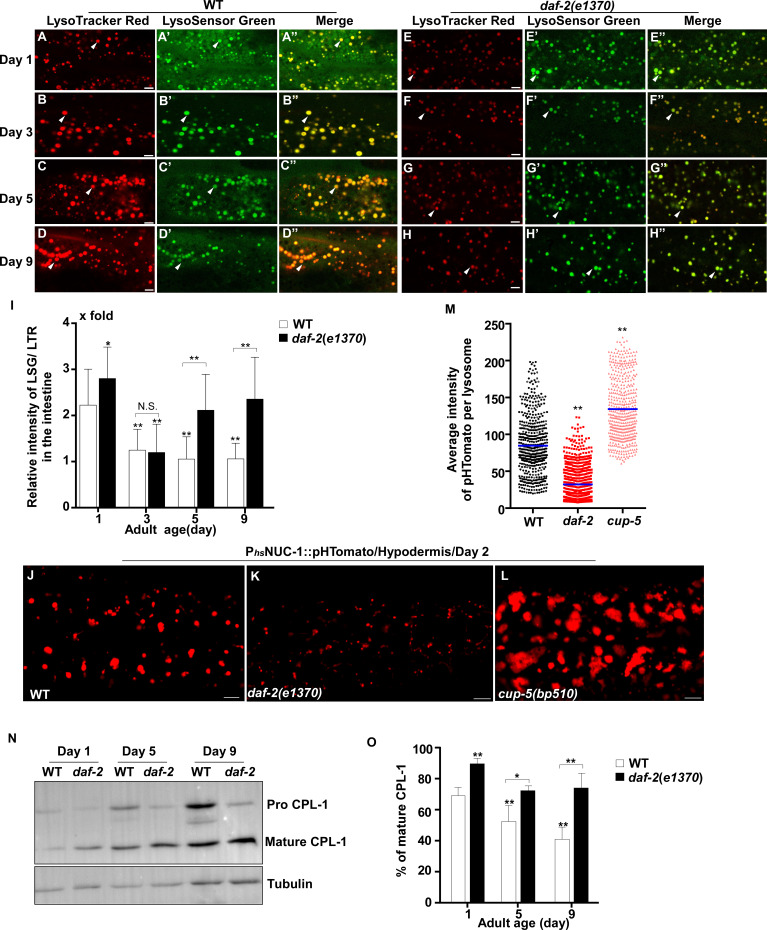
Figure 2. Lysosomal acidity and degradation activity are increased in daf-2.
(A–H”) Confocal fluorescence images of the intestine in wild type (WT; A–D”) and daf-2(e1370) (E–H”) adults at different ages stained by LSG DND-189 and LTR DND-99. (I) The relative intensity of LSG/LTR in wild type and daf-2(e1370) at different ages was quantified. At least 10 animals were scored in each strain at each day. (J–L) Confocal fluorescence images of the hypodermis at adult day 2 in wild type (WT; J), daf-2(e1370) (K) and cup-5(bp510) (L) expressing NUC-1::pHTomato controlled by the heat-shock (hs) promoter. The average intensity of pHTomato per lysosome is shown in (M). At least 20 animals were scored in each strain. (N) Western blot analysis of CPL-1 processing in wild type (WT) and daf-2(e1370) at different adult ages. The percentage of mature CPL-1 was quantified (O). Three independent experiments were performed. In (I, M, O), data are shown as mean ± SD. One-way ANOVA with Tukey's multiple comparisons test (I, M) or two-way ANOVA with Fisher’s LSD test (O) was performed to compare all other datasets with wild type (M) or wild type at day 1 (I, O), or to compare datasets that are linked by lines. *p<0.05; **p<0.001. All other points had p>0.05. N.S., no significance. Scale bars: 5 μm.


