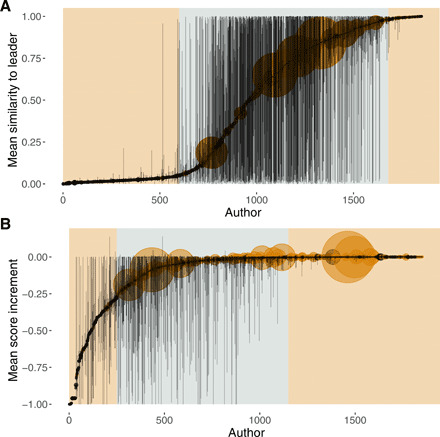
Fig. 1. Between- and within-individual variation in similarity and performance.

Similarity to current leader (A) and score increment (B)—average values with bars spanning the range of the distribution. The colored circles indicate leading contestants (i.e., contestants who submitted at least one entry that improved the overall score at the time of its submission), and the size of the circles is proportional to the total number of entries submitted by each contestant. The shaded panels in (A) indicate a visual split of participants into mavericks (left), copiers (right), and flexible users (middle) based on how they make use of social learning. The shaded panels (B) indicate a visual split between poorly performing contestants (left), contestants who are variable in performance (middle), and consistently good performers (right).
