
Fig. 2. Extraction of aggregated metrics from mobile phone data.
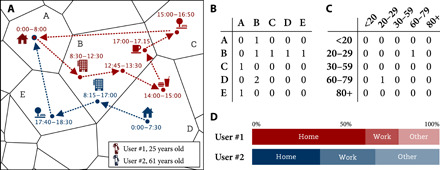
(A) Raw data representing 1-day mobility of two users. In this example, the area B is a hotspot, as it shows a high concentration of people. (B) OD matrix of five different areas, counting the number of trips from one area (rows) to another area (columns). (C) Contact matrix counting the number of potential face-to-face interactions between age groups. (D) Percentage of time spent at home, work, and other locations.