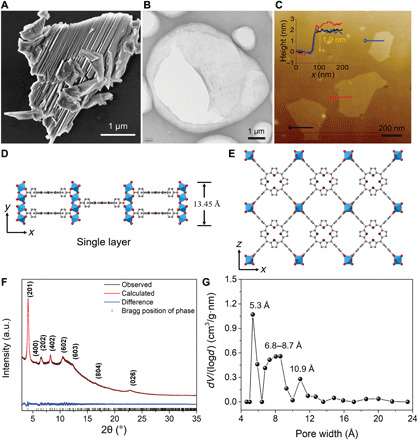
Fig. 1. Synthesis and structure of Al-MOF nanosheets.

(A) SEM image of the representative Al-MOF bulk crystals. (B) TEM image of exfoliated Al-MOF nanosheets. (C) AFM topographical image of Al-MOF nanosheets on a silicon wafer. Inset is the corresponding height profile. (D) Single monolayer Al-MOF nanosheet viewed from the [001] direction. (E) Crystal structure of Al-MOF viewed down the [010] direction. The Al coordination polyhedra are depicted in blue, whereas nitrogen, oxygen, and carbon atoms are shown in purple, red, and gray, respectively. H atoms are omitted for clarity. (F) Rietveld refinement of the synchrotron XRD data of Al-MOF nanosheets. a.u., arbitrary units. (G) Pore-size distribution of Al-MOF nanosheets from N2 adsorption-desorption measurement.
