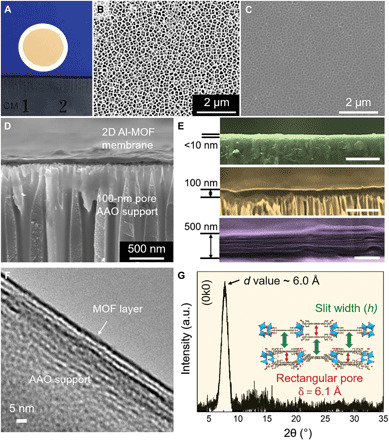
Fig. 2. Characterizations of Al-MOF membranes.

(A) Digital photo of an as-prepared 100-nm-thick Al-MOF laminar membrane on AAO substrate. (B) SEM image of a bare AAO substrate. (C) SEM image of a sub–10-nm-thick Al-MOF laminar membrane on AAO substrate. The visibility of substrate background elucidates the ultrathin coverage. (D) Cross-sectional overview of a 100-nm-thick Al-MOF laminar membrane on AAO substrate. (E) Magnified cross-sectional views of 2D Al-MOF membranes with different thicknesses. Membranes less than 100 nm (green and gold) show a compact stacking, whereas the membrane at a thickness of 500 nm (purple) apparently shows typical laminar structure. Scale bars, 500 nm. (F) Cross-sectional TEM image of the 2D Al-MOF laminar membrane. (G) GIXRD pattern of the Al-MOF laminar membrane. The pattern was acquired from a thick membrane (~20 μm) due to the detection limit. The sharp (0k0) phase peak at 2θ = 7.6° indicates an average value of 6.0 Å.
