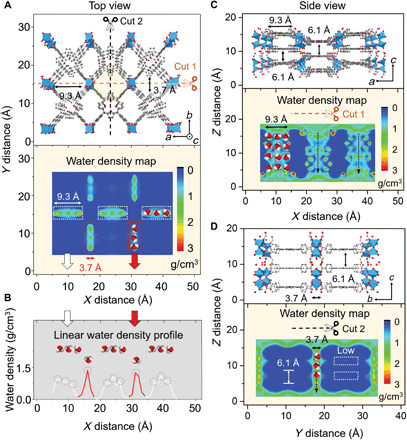
Fig. 4. Water transport behavior through Al-MOF membranes.

(A) Crystalline illustration of Al-MOF membrane constructed with two-layer nanosheets under AB stacking sequence (viewed along the [010] direction). Dashed lines present two different incision positions for cross-sectional membrane geometries (marked with cut 1 and cut 2, respectively). Below figure is the corresponding water density map. The blue color corresponds to no water existence and the red corresponds to the maximum water density. (B) Linear water density profile collected from the upper water density map. White lines represent the water density in the three arranged pores (9.3 Å in the X axis × 3.7 Å in the Y axis), and red lines refer to that in the two arranged pores (3.7 Å in the X axis × 9.3 Å in the Y axis), as illustrated in white and red dashed rectangles, respectively. (C) Side view of the membrane at cut 1 section is viewed along the [001] direction, which gives the interlayer distance of 6.1 Å. Below figure is the corresponding water density map. (D) Side view of the membrane at cut 2 section is viewed along the [100] direction. White dashed rectangles stand for the low-water densities inside the interlayer space.
