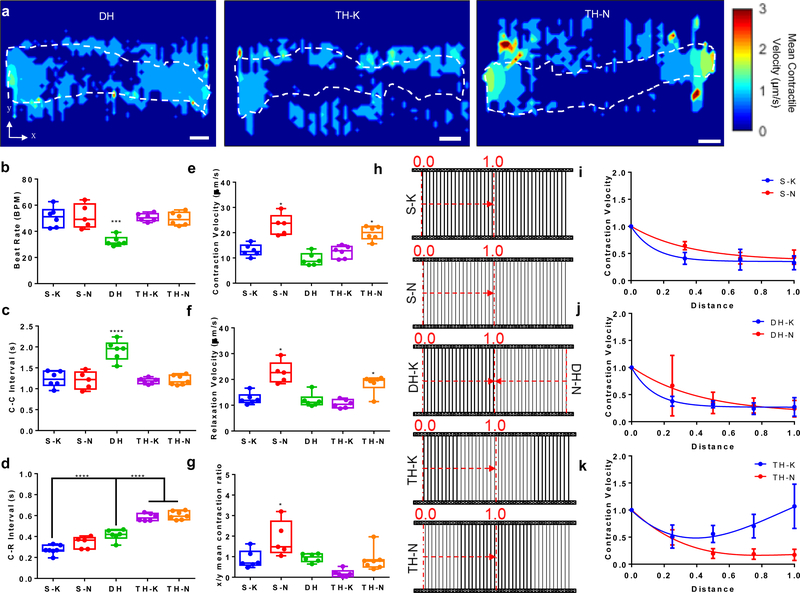
Figure 2. Contractile motion velocities of cardiac microtissues under mechanical nonuniformity.
(a) Contractile velocity heatmaps of cardiac microtissues on DH, TH-K and TH-N matrices. Most motion occurred at the edge of cardiac microtissues. White dashed lines depicted the contour of cardiac microtissues. Scale bars: 100 μm. Among all the matrix designs, the cardiac microtissues on DH matrices exhibited (b) slower beat rate and (c) longer C-C time intervals (time between two consecutive contraction peaks). (d) The cardiac microtissues on TH matrices manifested significantly longer C-R interval (time between two coupled contraction and relaxation peaks) than the ones from other matrix designs. The cardiac microtissues on the matrices with thick fiber edges (S-K, DH and TH-K) showed significantly (e) lower contraction velocity, and (f) lower relaxation velocity compared to matrices with thin fiber edges (S-N and TH-N). (g) The ratio of mean contraction velocities between X-axis (perpendicular to fiber direction) and Y-axis (parallel to fiber direction) showed that the cardiac microtissues on S-N matrices maintained high anisotropic contraction, compared to the other matrix designs. (h) Contraction velocity decay curves of the cardiac microtissues from edge (segment “0.0”) to center (segment “1.0”), indicated by the red dash arrows, was analyzed for (i) single matrices (S-N versus S-K), (j) DH matrices (DH-N versus DH-K), and (k) TH matrices (TH-N versus TH-K), and showed distinct spatial characteristics between the matrices with thick fiber edges and the matrices with thin fiber edges. Statistical analysis: ANOVA with Tukey’s multiple comparisons test (*p < 0.05, ***p < 0.001, ****p < 0.0001). Data is shown as minimum, maximum, median, and 25th and 75th percentiles for box plots (n ≥ 5).

