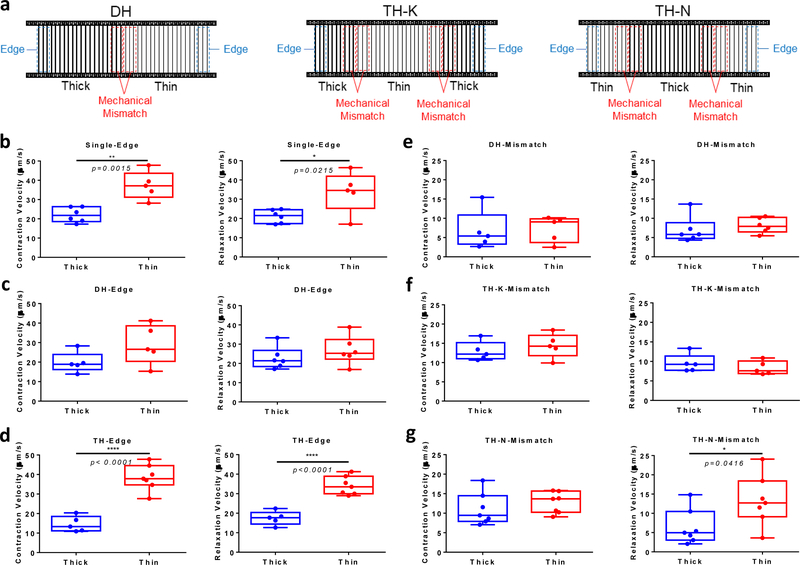
Figure 3. Local contractile behavior of cardiac microtissues at mechanical mismatch regions.
(a) Analysis diagram of local contractile motion velocity on DH, TH-K and TH-N matrices. Blue dash box indicates the region-of-interest (ROI) at the matrix edges, and red dash box indicates the ROI at the mechanical mismatch regions. For TH matrices, the local velocities for two mismatch regions were averaged. Comparison of local contraction and relaxation velocity at matrix edges (b) between S-K and S-N matrices, (c) between thick side and thin side of DH matrices, and (d) between TH-K and TH-N matrices showed higher contractile motion velocity at thin fiber edges than thick fiber edges for single and TH matrices, but not DH matrices. Comparison of local contraction and relaxation velocity at mechanical mismatch regions within (e) DH matrices, (f) TH-K matrices and (g) TH-N matrices showed continuity of contractile motion across the mismatch line, except for the relaxation discontinuity at the TH-N mismatch regions. Statistical analysis: two-tailed student t-test (*p < 0.05, **p < 0.005 ****p < 0.0001). Data is shown as minimum, maximum, median, and 25th and 75th percentiles for box plots (n≥5).

