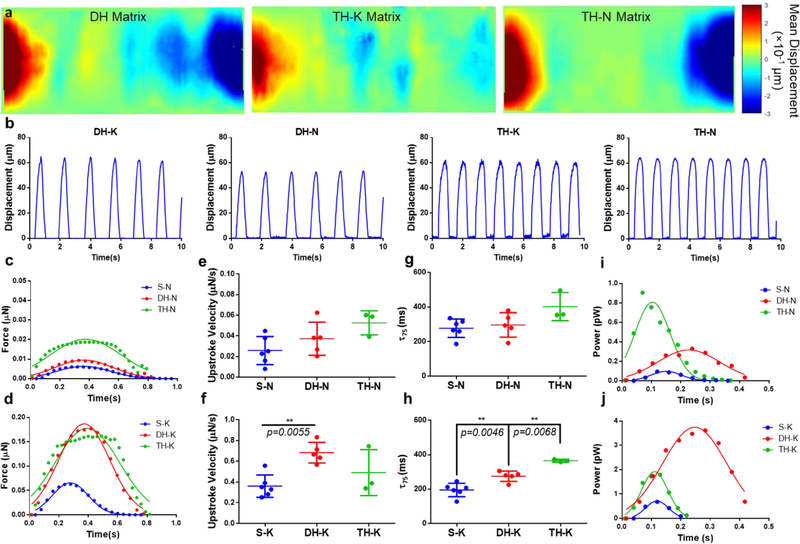
Figure 4. Force kinetics and power output of cardiac microtissues under mechanical nonuniformity.
(a) Displacement heatmaps of entire cardiac microtissues on the DH and TH matrices. Positive and negative values indicated the displacement in opposite directions. (b) Displacement waveforms for the cardiac microtissues at matrix edges of DH and TH matrices. The force kinetics of cardiac microtissues (c) on thin-dominant matrices showed a sequential increase of contraction force with the increase of nonuniformity, while (d) on thick-dominant matrices showed comparable contraction forces between DH-K and TH-K matrices. The power output of cardiac microtissues showed (e) the highest power output from TH-N matrices among the thin-dominant matrices, but (f) the highest power output from DH-K matrices among the thick-dominant matrices. The force upstroke velocity of cardiac microtissues showed (g) faster force development on the DH-K matrices compared to S-K matrices, (h) but no differences were observed for the thin-dominant matrices. The force decay of cardiac microtissues showed (i) an increased trend of time decay for S-K compared to TH-K matrices but (j) no significant difference among thin-dominant matrices. Statistical analysis: ANOVA with Tukey’s multiple comparisons test (*p < 0.05, **p < 0.005, ****p < 0.0001). Data is shown as mean ± s.d. (n≥3).

