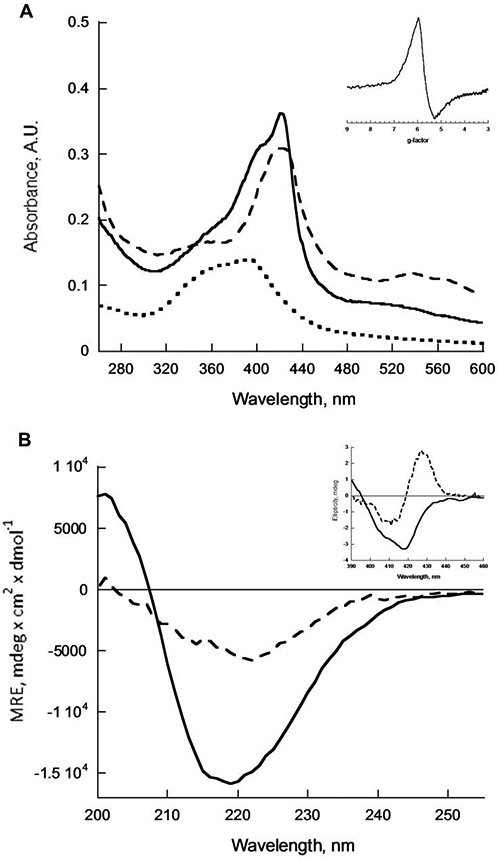
Figure 1.

(A) UV-Vis spectra of 4 μM hemin (dotted trace), mixture of 30 μM Ac-LHLHLFL-NH2 with 4 μM hemin (dashed trace) and 30 μM Ac-LILHLFL-NH2 with 4 μM hemin (solid trace). Inset: EPR spectrum of 750 μM Ac-LILHLFL-NH2 with 100 μM hemin (B) Circular Dichroism spectra of 30 μM Ac-LHLHLFL-NH2 (dashed trace) and 30 μM Ac-LILHLFL-NH2 (solid trace). Inset: CD of Soret band of LHLHLFL-NH2 with 4 μM hemin (dashed trace) and 30 μM Ac-LILHLFL-NH2 with 4 μM hemin (solid trace). All measurements were taken in 100 mM phosphate buffer at pH 7 after 24 hours of incubation.
