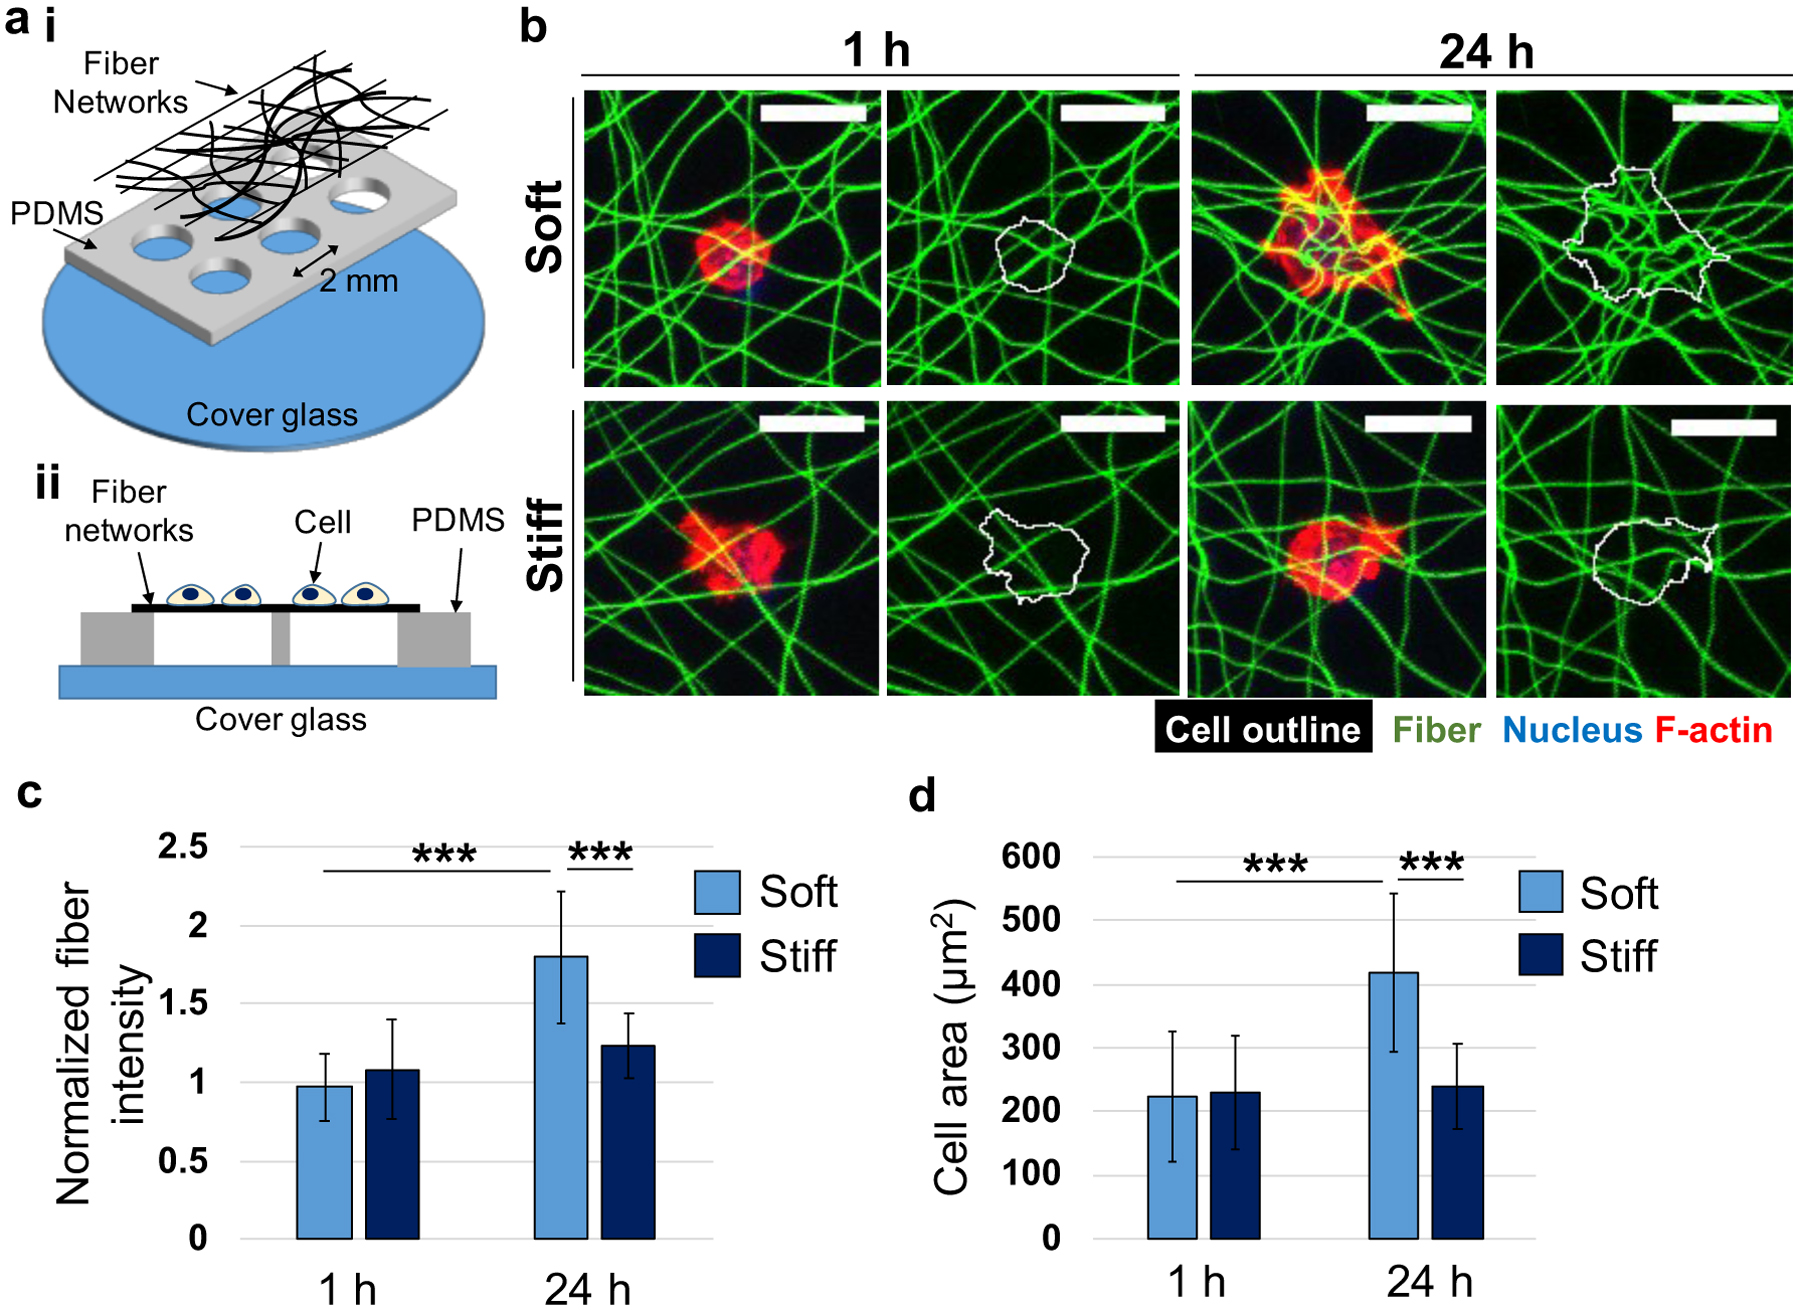
Figure 2.

Meniscal fibrochondrocyte (MFC) behavior on thin layers of soft and stiff fibrous networks. (a) Schematic of PDMS wells containing suspended thin fibrous networks, viewed from the (i) top or (ii) side. MFCs were seeded on top of the PDMS wells. (b) Representative maximum projection images of MFCs cultured on soft and stiff fibrous networks (green) for 1 or 24 h. Cells were labeled for nucleus (blue) and F-actin (red) and an outline around each cell was drawn (white). Scale bar is 20 μm. Quantification of (c) normalized fiber intensity (fiber density) at cellular regions and (d) MFC spreading area. Soft, 1 h: n = 24; Stiff, 1 h: n = 19; Soft, 24 h: n = 23; Stiff, 24 h: n = 13 cells. Two-way ANOVA with Tukey’s post hoc testing. ***p < 0.001.
