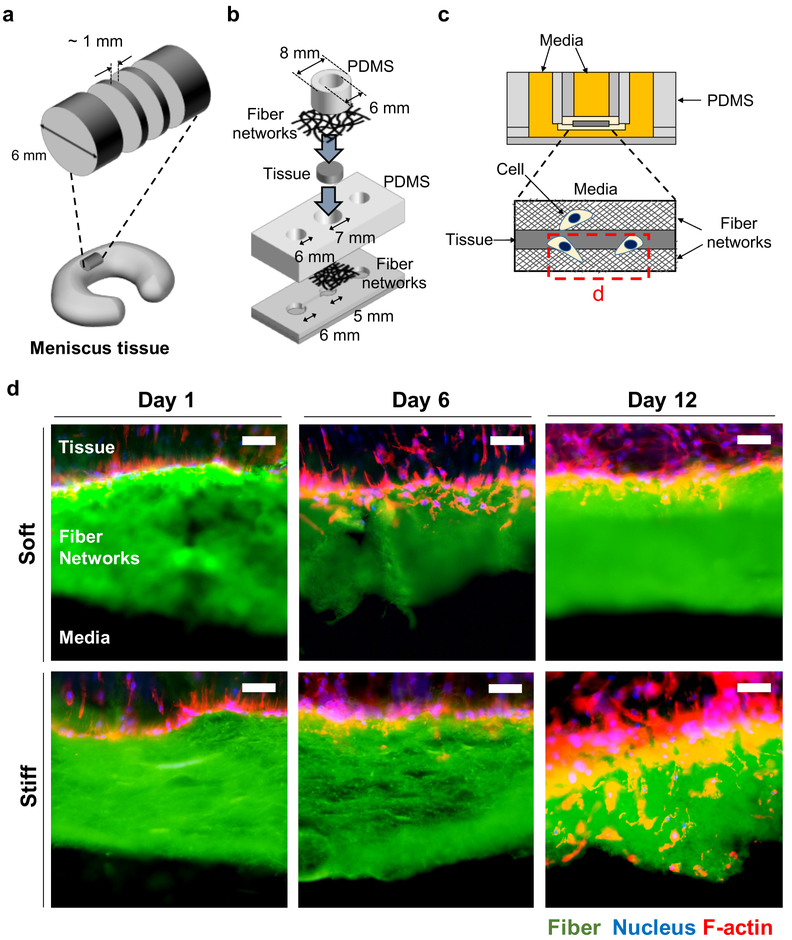
Figure 4.
Cell migration chamber to study MFC migration into thick fibrous networks. (a-c) Schematic of (a) slicing meniscal tissue, (b) cell migration chamber sandwiching a tissue slice, and (c) cross-section view of assembled migration chamber. Red dotted box in c indicates acquisition position of images in d. (d) Representative cryo-sectioned images of tissues sandwiched between soft and stiff fibrous networks (green). Cells were fixed on days 1, 6, and 12, and stained for nuclei (blue) and F-actin (red). Scale bar is 50 μm.

