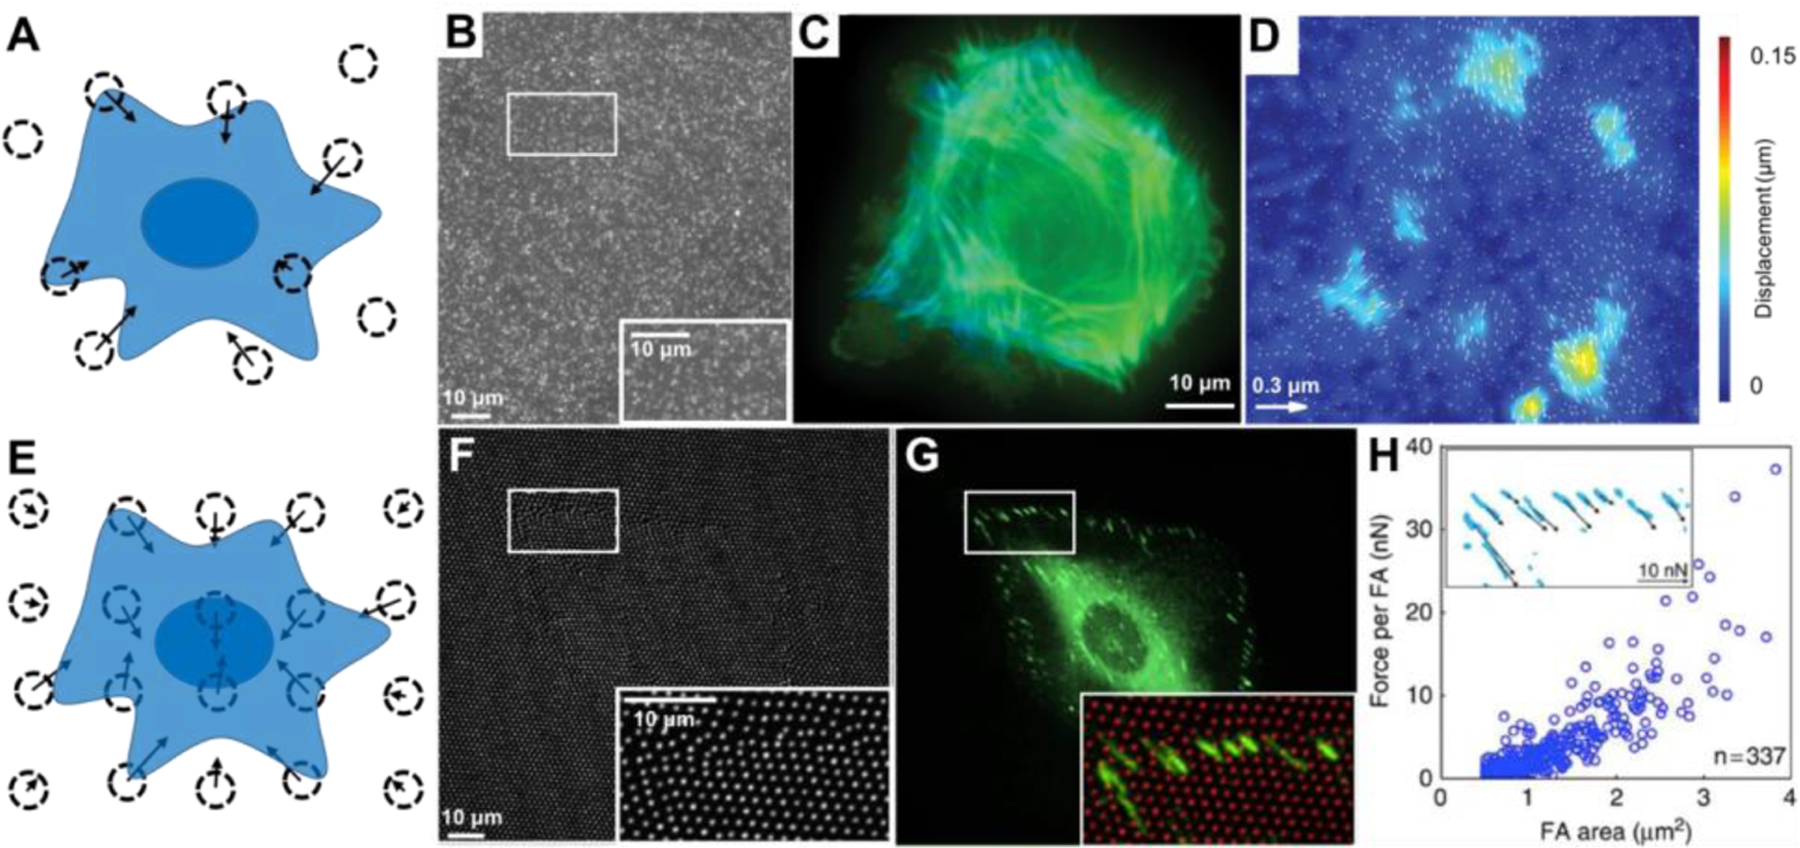
Figure 3:

Cellular forces have been measured by the displacement of beads embedded in polysiloxane. (A) Surface displacements can be calculated from the movement of beads randomly embedded in the material. Dotted circles indicate the bead location after cellular displacement and the arrows indicate the magnitude and direction of their displacement. (B-D) Fluorescent microscopy allows for the analysis of bead displacements (white dots in B) and spatially arrangement of actin filaments (green and blue in C, where blue is the actin closer to the surface). Bead displacement vectors can be calculated (arrows in D) and overlaid on a colormap to visualize areas of large displacements (colors in D, units of colormap are μm.). (E) Beads can also be placed in a non-random orthogonal or hexagonal pattern. (F-H) Fluorescent microscopy allows for imaging the displaced position of the bead (white dots in F and red dots in the inset in G) along with fluorescent microscopy of their focal adhesions (FA) by paxillin (green in G) to examine the relationship between FA area and cellular forces (graph in H, inset in H shows zoom region of FAs with force vectors indicated location, direction, and magnitude). B-D are adapted under the terms of Creative Commons Attribution 4.0 International License.[18] Copyright 2011, Public Library of Sciences. F-H are adapted under the terms of Creative Commons Attribution 4.0 International License.[19] Copyright 2016, Springer Nature.
