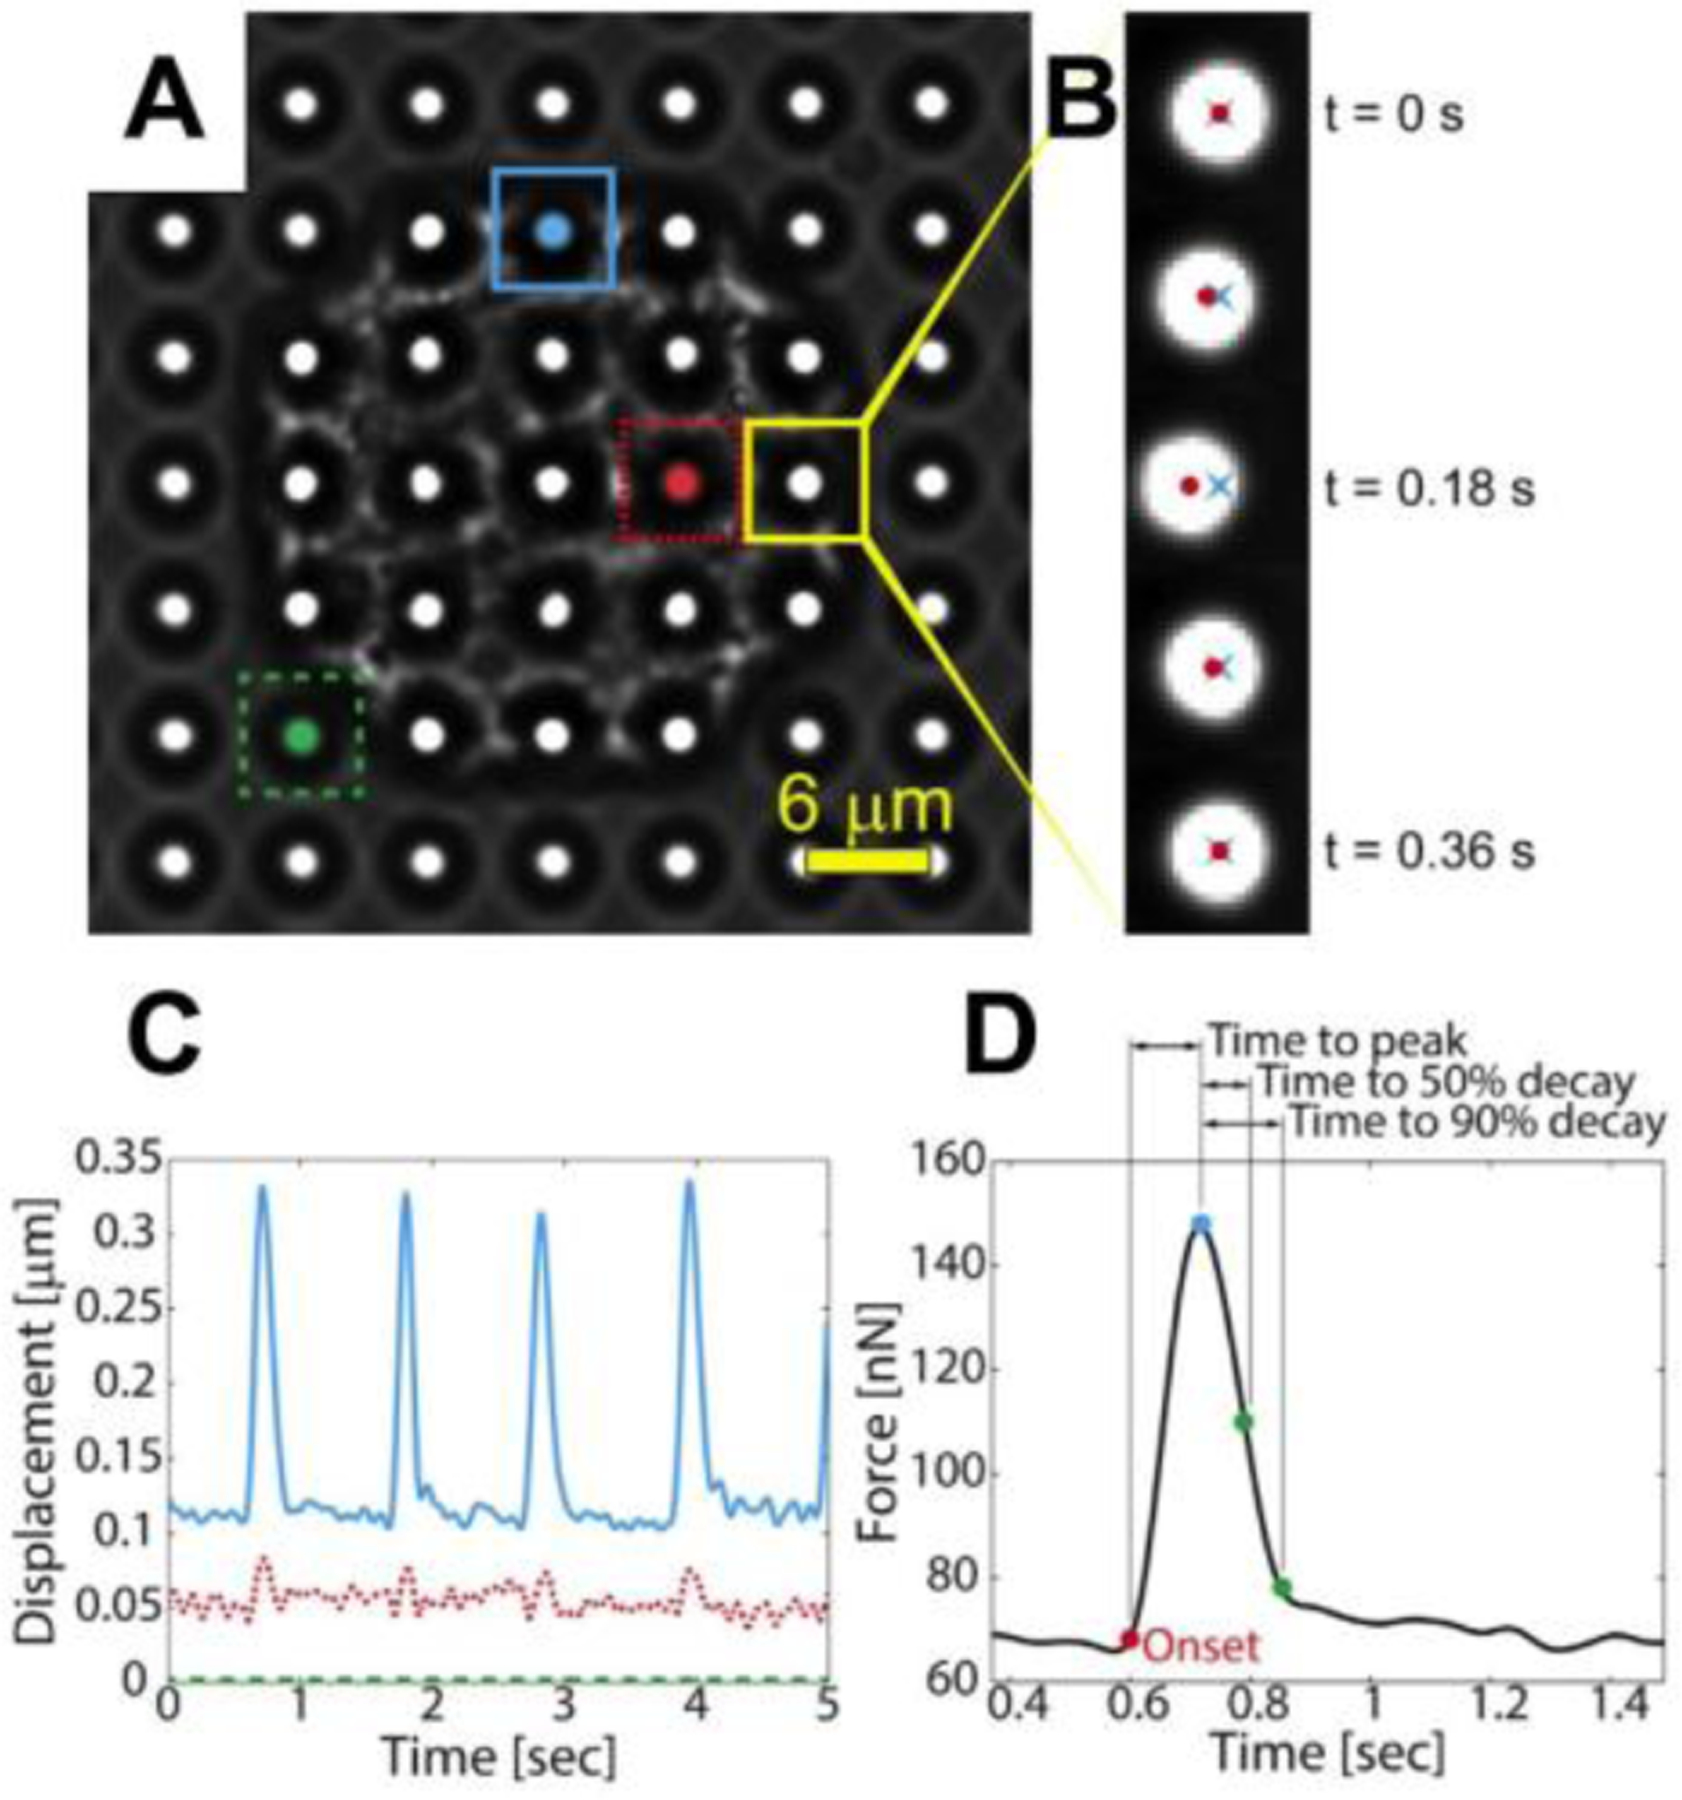
Figure 5.

Quantification of cellular forces by tracking the displacement of the microposts. (A) A single cardiomyocyte is shown on microposts. (B) The displacement of a post is tracked over time by determining the distance from the centroid of the tip of the post (red dot) to its undeflected position (blue “x”). (C) The dynamics if a cell’s contractile forces can be monitored as shown by the displacement vs. time and (D) force vs. time graphs. Posts near the boundary of the cell (blue) tend to deflect more than posts near the center of the cell (red), while posts where the cell is not attached do not deflect (green). Reproduced with permission.[59] Copyright 2016, Elsevier.
