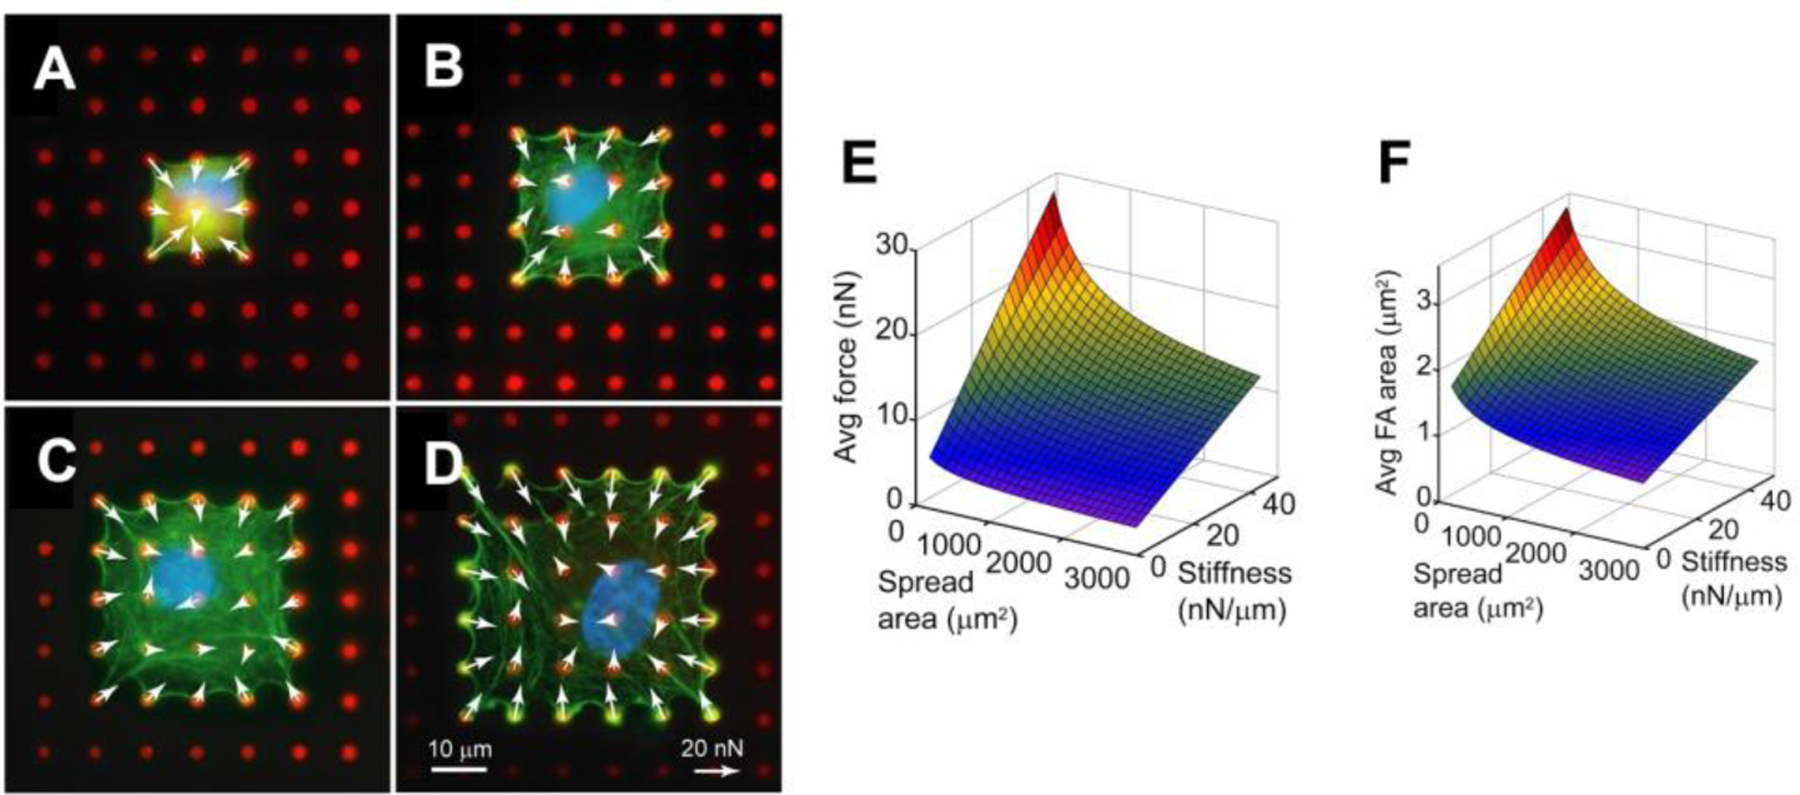
Figure 6.

Human pulmonary artery endothelial cells confined to areas of (A) 441 μm2, (B) 900 μm2, (C) 1521 μm2, and (D) 2304 μm2. The red dots are microposts and white arrow represent force vectors. Surface plots indicate that the (E) average cell-matrix force and (F) average focal adhesion area has an inverse relationship with spread area and stiffness. Adapted with permission.[52] Copyright 2012, Elsevier.
