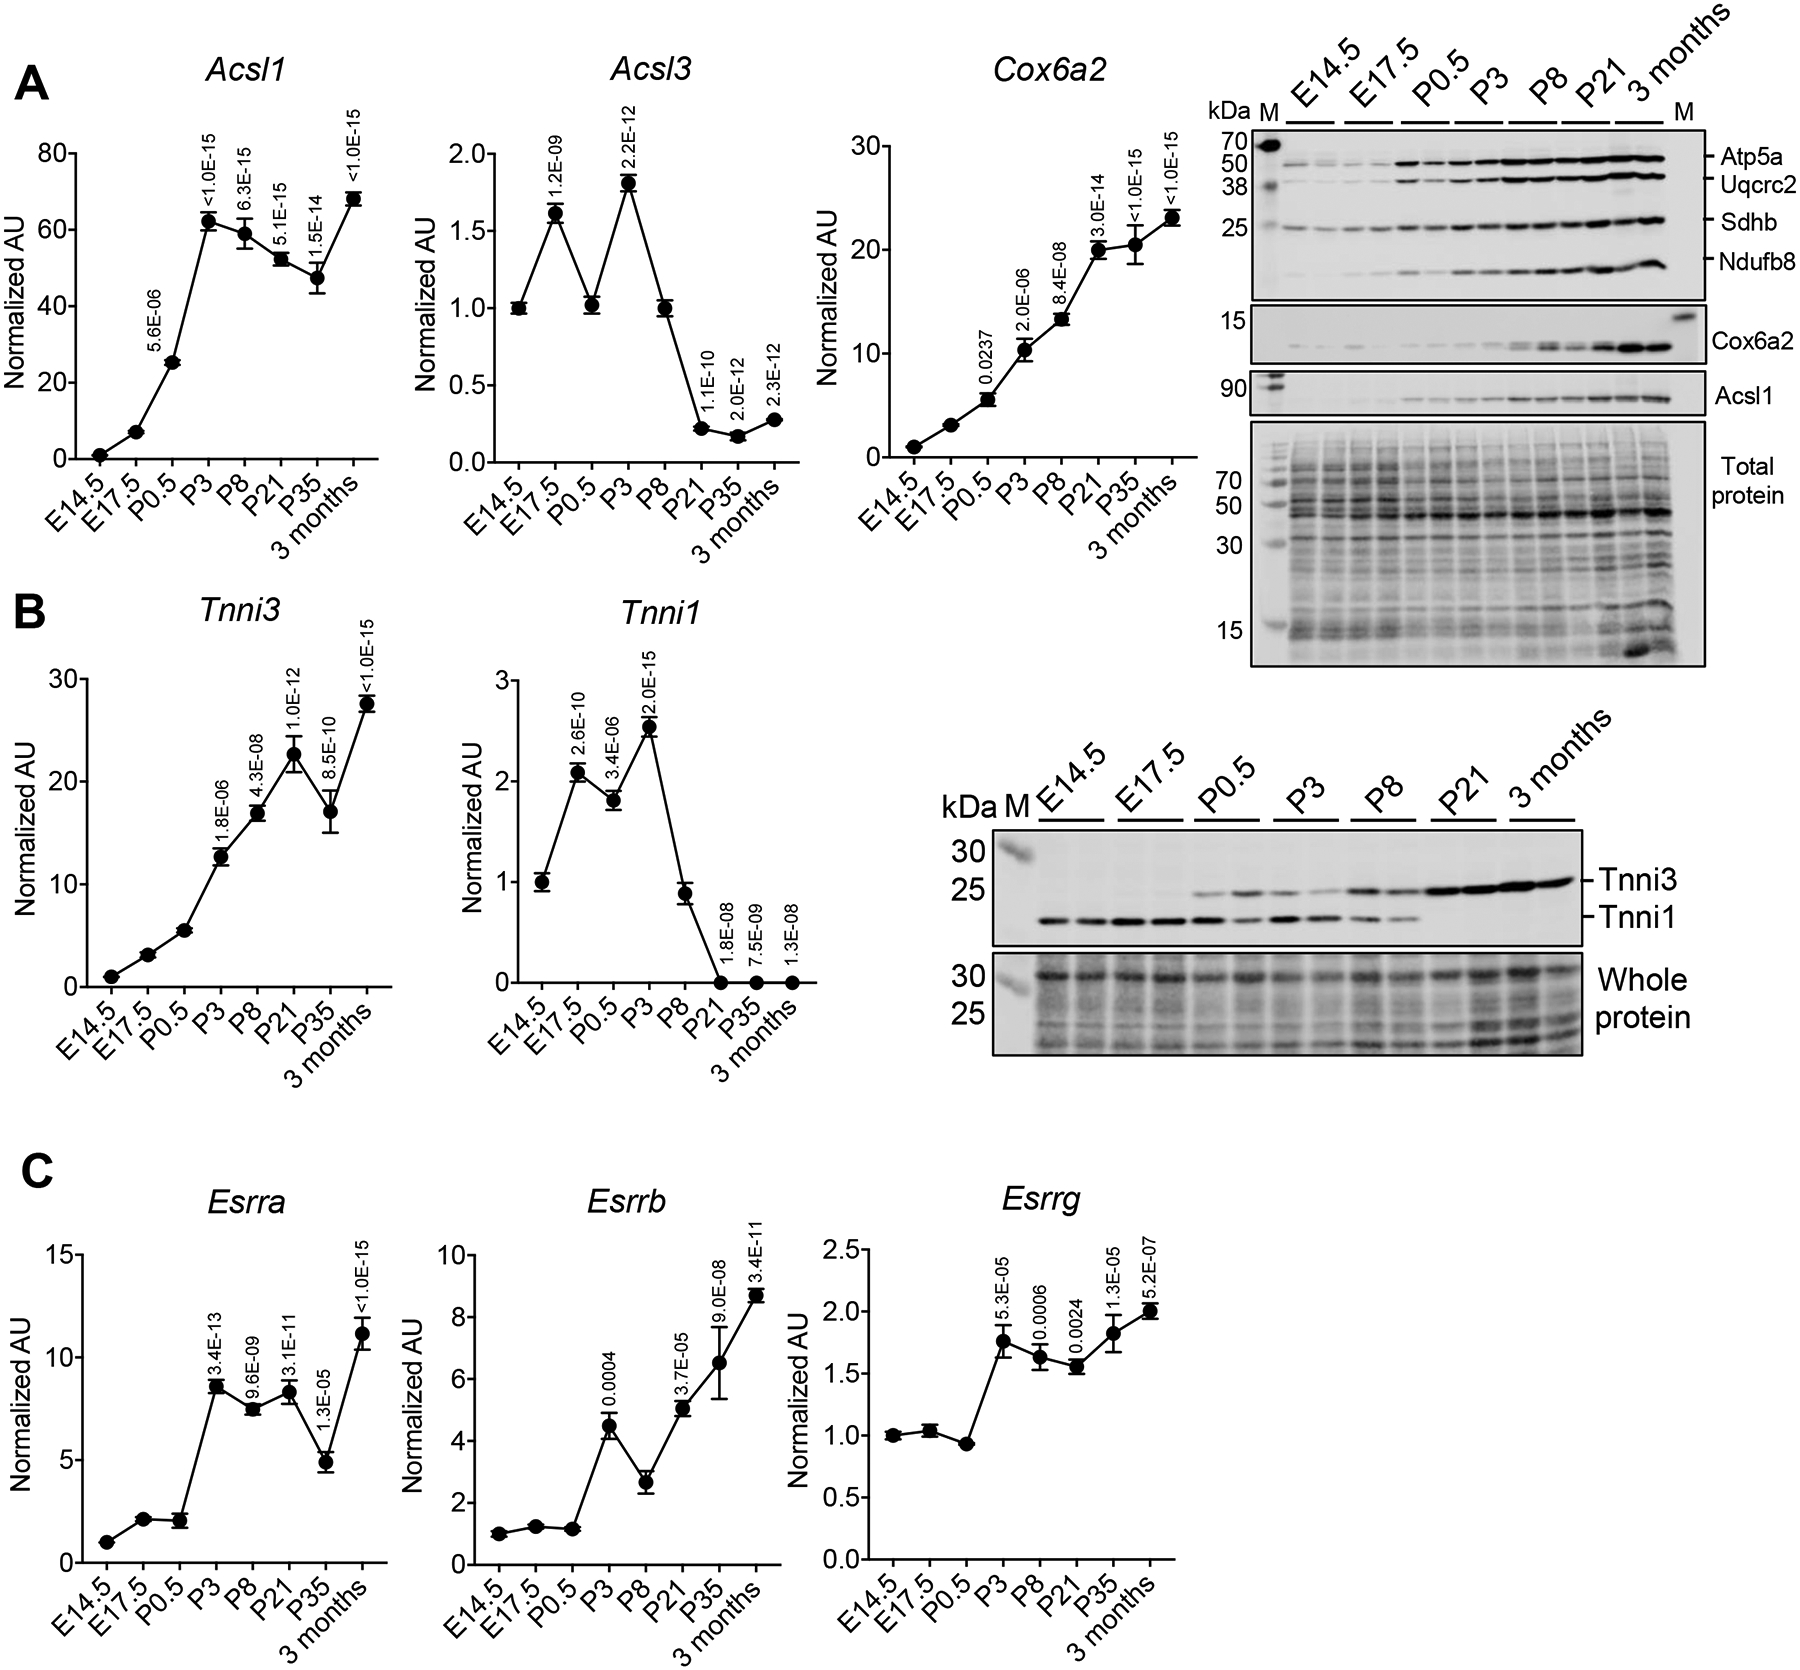
Figure 1. Induction of Esrr gene expression during postnatal cardiac development.

RT-qPCR-determined levels of the designated mRNAs during mouse postnatal cardiac development (from E14.5 to 3 months, n=3–5 per timepoint). Levels are shown as arbitrary units (AU) normalized to levels at E14.5 (A) Left: Levels of mRNA encoding Acsl1, Acsl3, and Cox6a2. Right: Representative immunoblot images of OXPHOS, Cox6a2, and Acsl1 proteins. Whole protein is shown as a control for loading. (B) Left: Levels of mRNA encoding Tnni3 and Tnni1. Right: Representative immunoblot image of Tnni3 and Tnni1 proteins. (C) Levels of mRNA encoding Esrra, Esrrb and Esrrg. p-values are indicated on the graphs, 1 way-ANOVA followed by Dunnett’s multiple comparisons test vs E14.5. All bars represent the mean ± SEM. Total protein staining at the corresponding molecular weight position was presented as a loading control for the representative immunoblot images. M indicates the protein marker lane. All immunoblot images were obtained with LI-COR Odyssey Fc. The qPCR raw data for Acsl1, Cox6a2, Tnni3, and Esrra are available in Online Table VIII.
