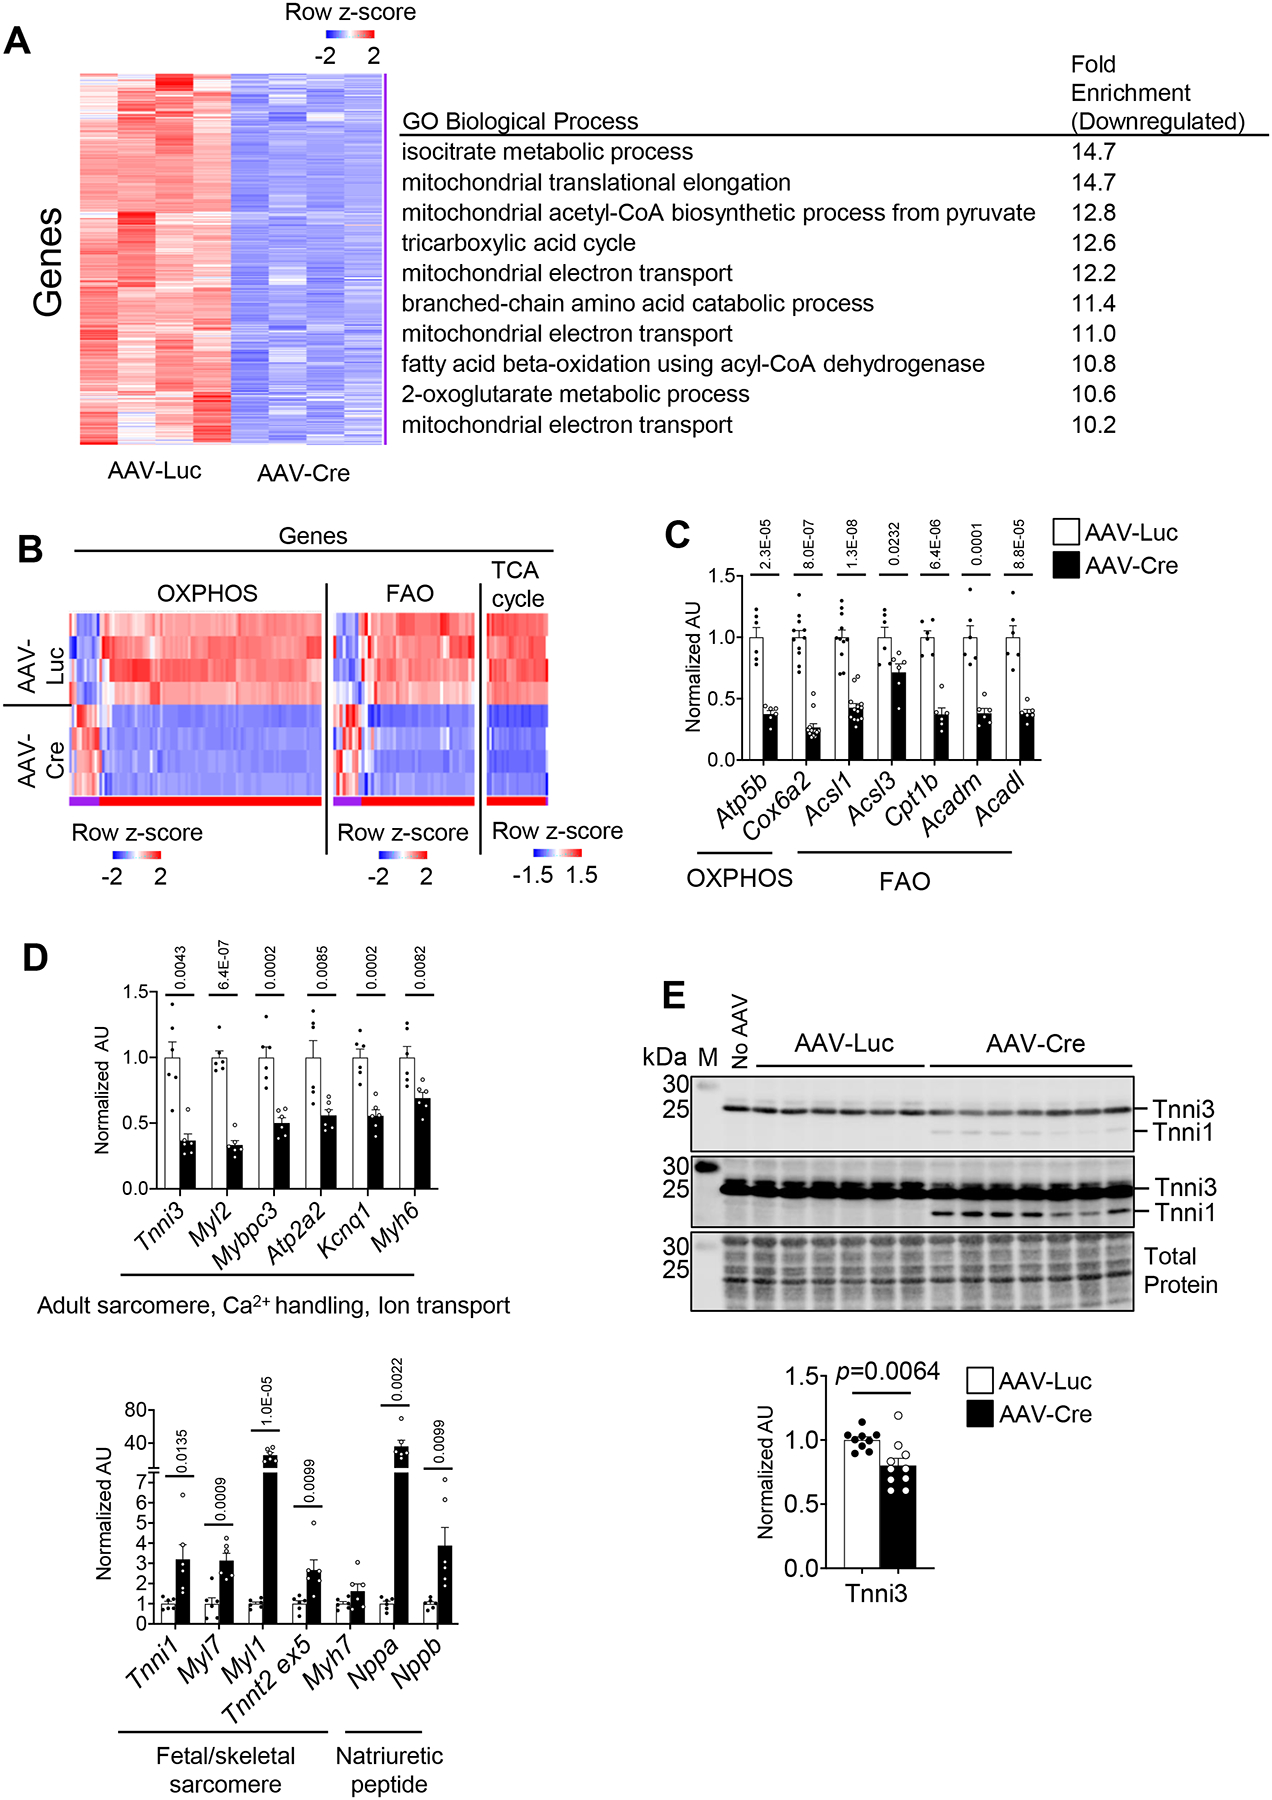
Figure 3. ERRα/γ is necessary for the postnatal cardiac maturation transcriptional program.

Whole genome RNA-seq was performed on ventricles from AAV-Luc or Cre-injected ERRα/γflox/flox. (A) Left: Heat map represents z-score of mRNA levels significantly downregulated from RNA-seq data performed on ventricles from AAV-Luc or Cre-injected ERRα/γflox/flox. 2032 genes downregulated in the Cre group are shown. Right: Significantly enriched GO Biological Process using transcripts downregulated in the AAV-Cre ventricles as compared to AAV-Luc controls. (B) Heat map represents z-score of mRNA levels of metabolic transcripts encoding OXPHOS, TCA cycle, and FAO proteins. (C) Levels of mRNA transcripts encoding energy metabolic genes, and (D) sarcomere proteins, ion channels, and natriuretic peptides in ventricles from male AAV-Luc (n=6–11) or Cre (n=6–13) -injected ERRα/γflox/flox mice as measured by RT-qPCR. p-values are indicated on the bar graphs comparing AAV-Luc vs AAV-Cre. Student’s t-test or Mann-Whitney U test was used (see Detailed Methods). Bars represent the mean ± SEM. (E) Upper: Representative immunoblot images of Tnni1/3 in 5-week old injected ERRα/γflox/flox ventricles subjected to AAV-Luc (n=6), AAV-Cre (n=7) or without AAV injection (No AAV) using an anti-pan Tnni antibody at two different exposures. Bottom: Bar graphs show the amount of Tnni3 protein expression in ERRα/γflox/flox ventricles injected with AAV-Luc (n=9) or AAV-Cre (n=10). Student’s t-test was used. M indicates the protein marker lane. Total protein staining was used as a loading control. All immunoblot images were obtained with LI-COR Odyssey Fc.
