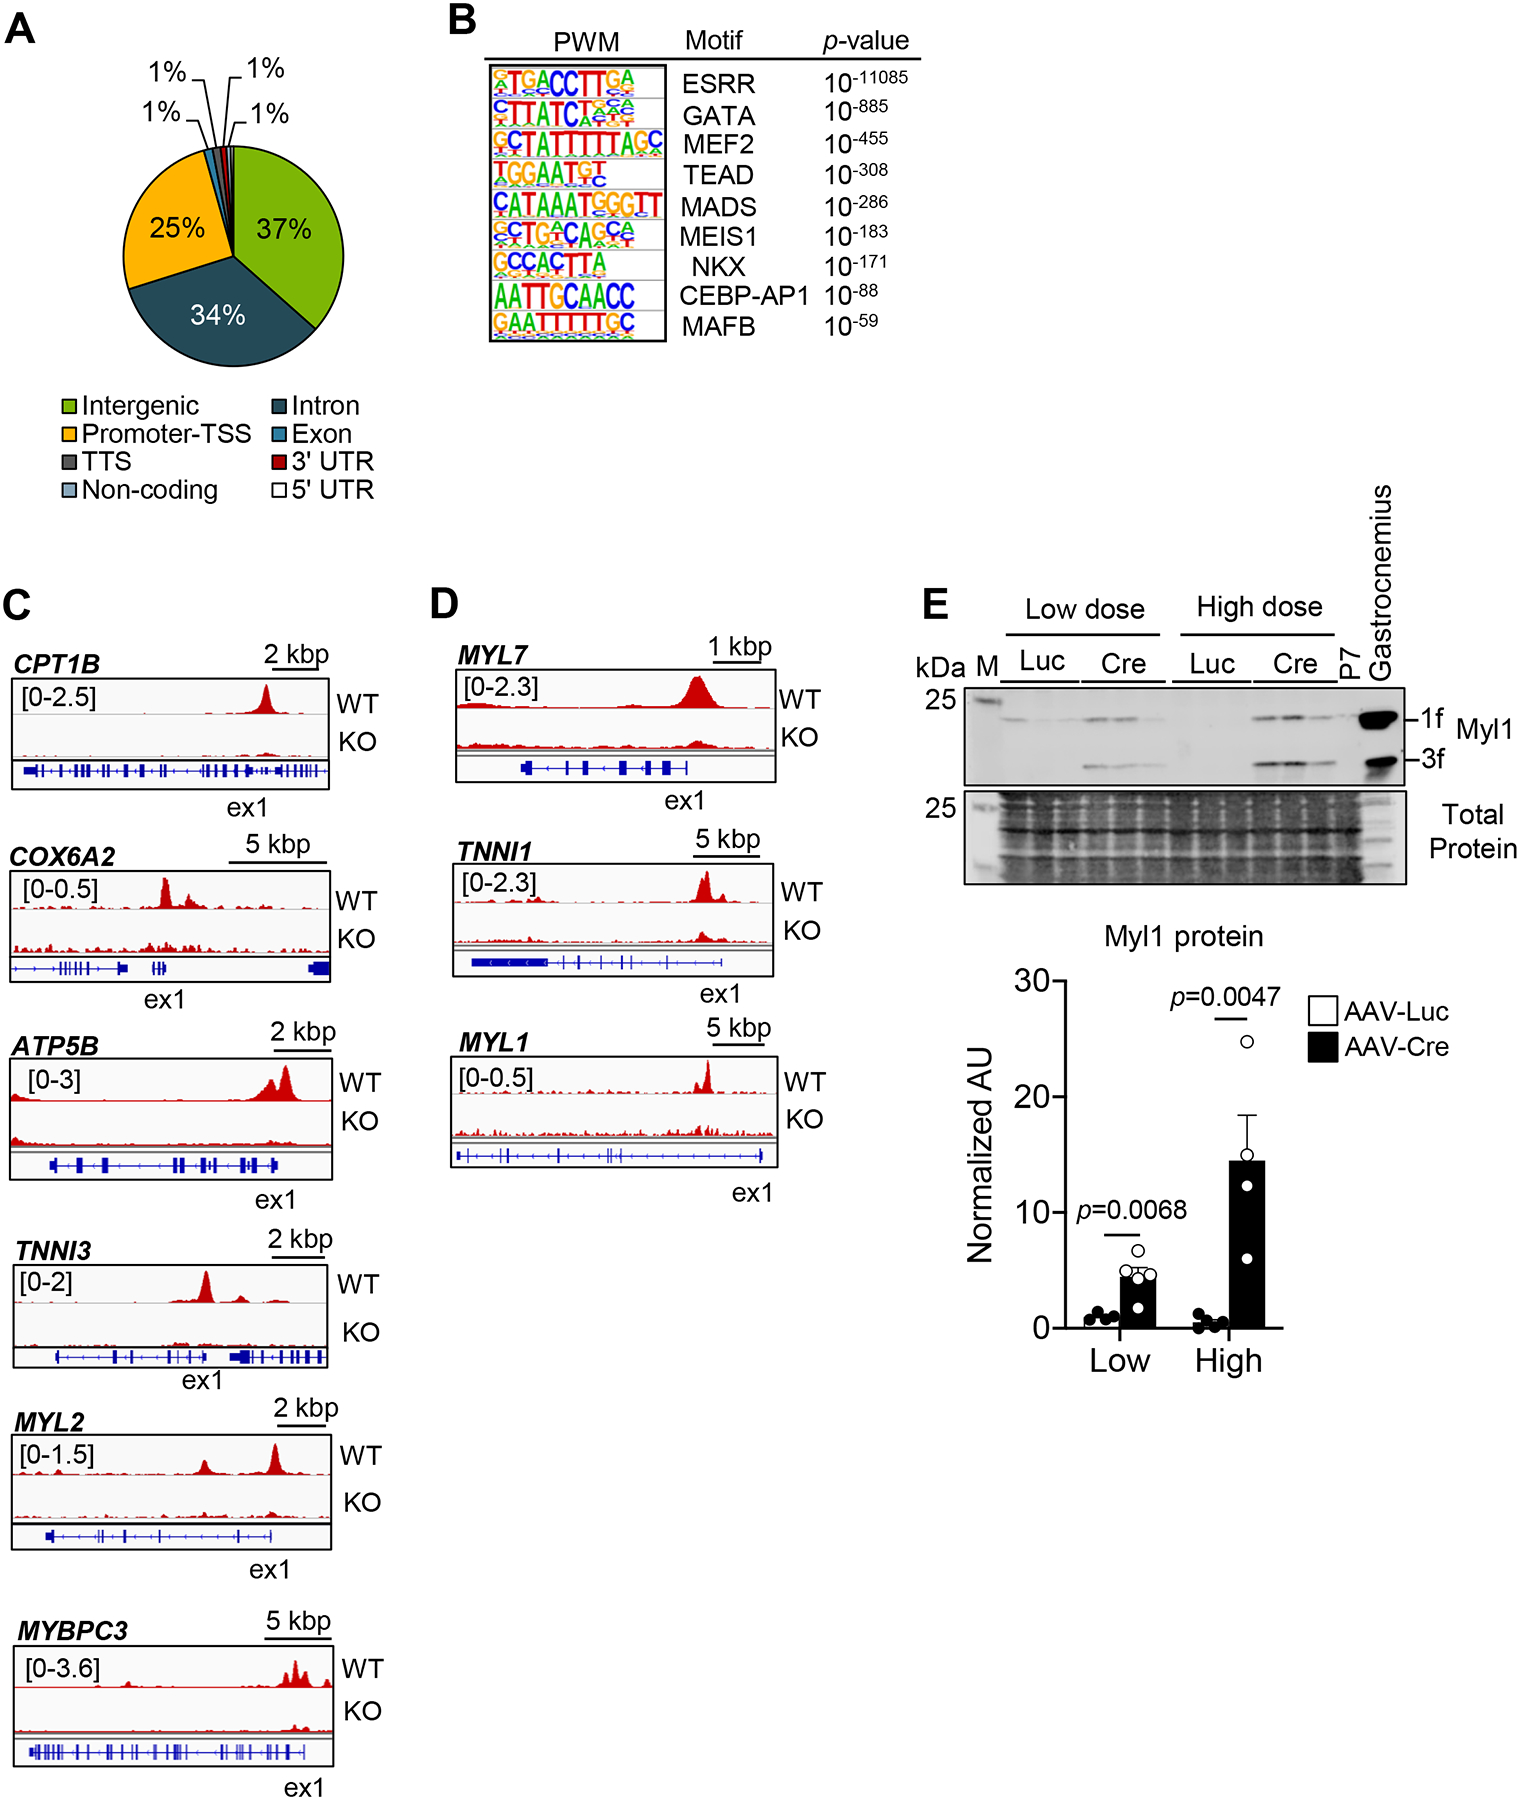
Figure 4. Analysis of the ERRγ cistrome indicates direct transcriptional control of adult cardiac metabolic and contractile protein genes.

(A) Pie chart of ERRγ peak distribution determined from whole genome ChIP-seq data. Promoter transcription start site (TSS) was defined as −5 kbp or within the first intron. (B) Significantly enriched ERRγ binding motifs as defined by PWM motif analysis. Representative genome browser tracks of ERRγ peaks on the activated-targets (C) and the suppressed-targets (D) in WT and ERRγ KO hiPSC- CMs. Number in brackets indicates RPM (reads per million). (E) Left: Representative immunoblot images of Myl1 in 5-week old injected ERRα/γflox/flox ventricles subjected with low dose AAV-Luc or AAV-Cre. Right: Bar graphs depict quantification of Myl1 immunoblot analysis conducted on samples prepared from ERRα/γflox/flox ventricles subjected to low or high dose AAV-Luc (n=4) or AAV-Cre (n=4–5). Student’s t-test was used. Gastrocnemius muscle from aged-match wild type mouse was used as a positive control for Myl1. Total protein staining was used as a loading control. M indicates the protein marker lane. All immunoblot images were obtained with LI-COR Odyssey Fc.
