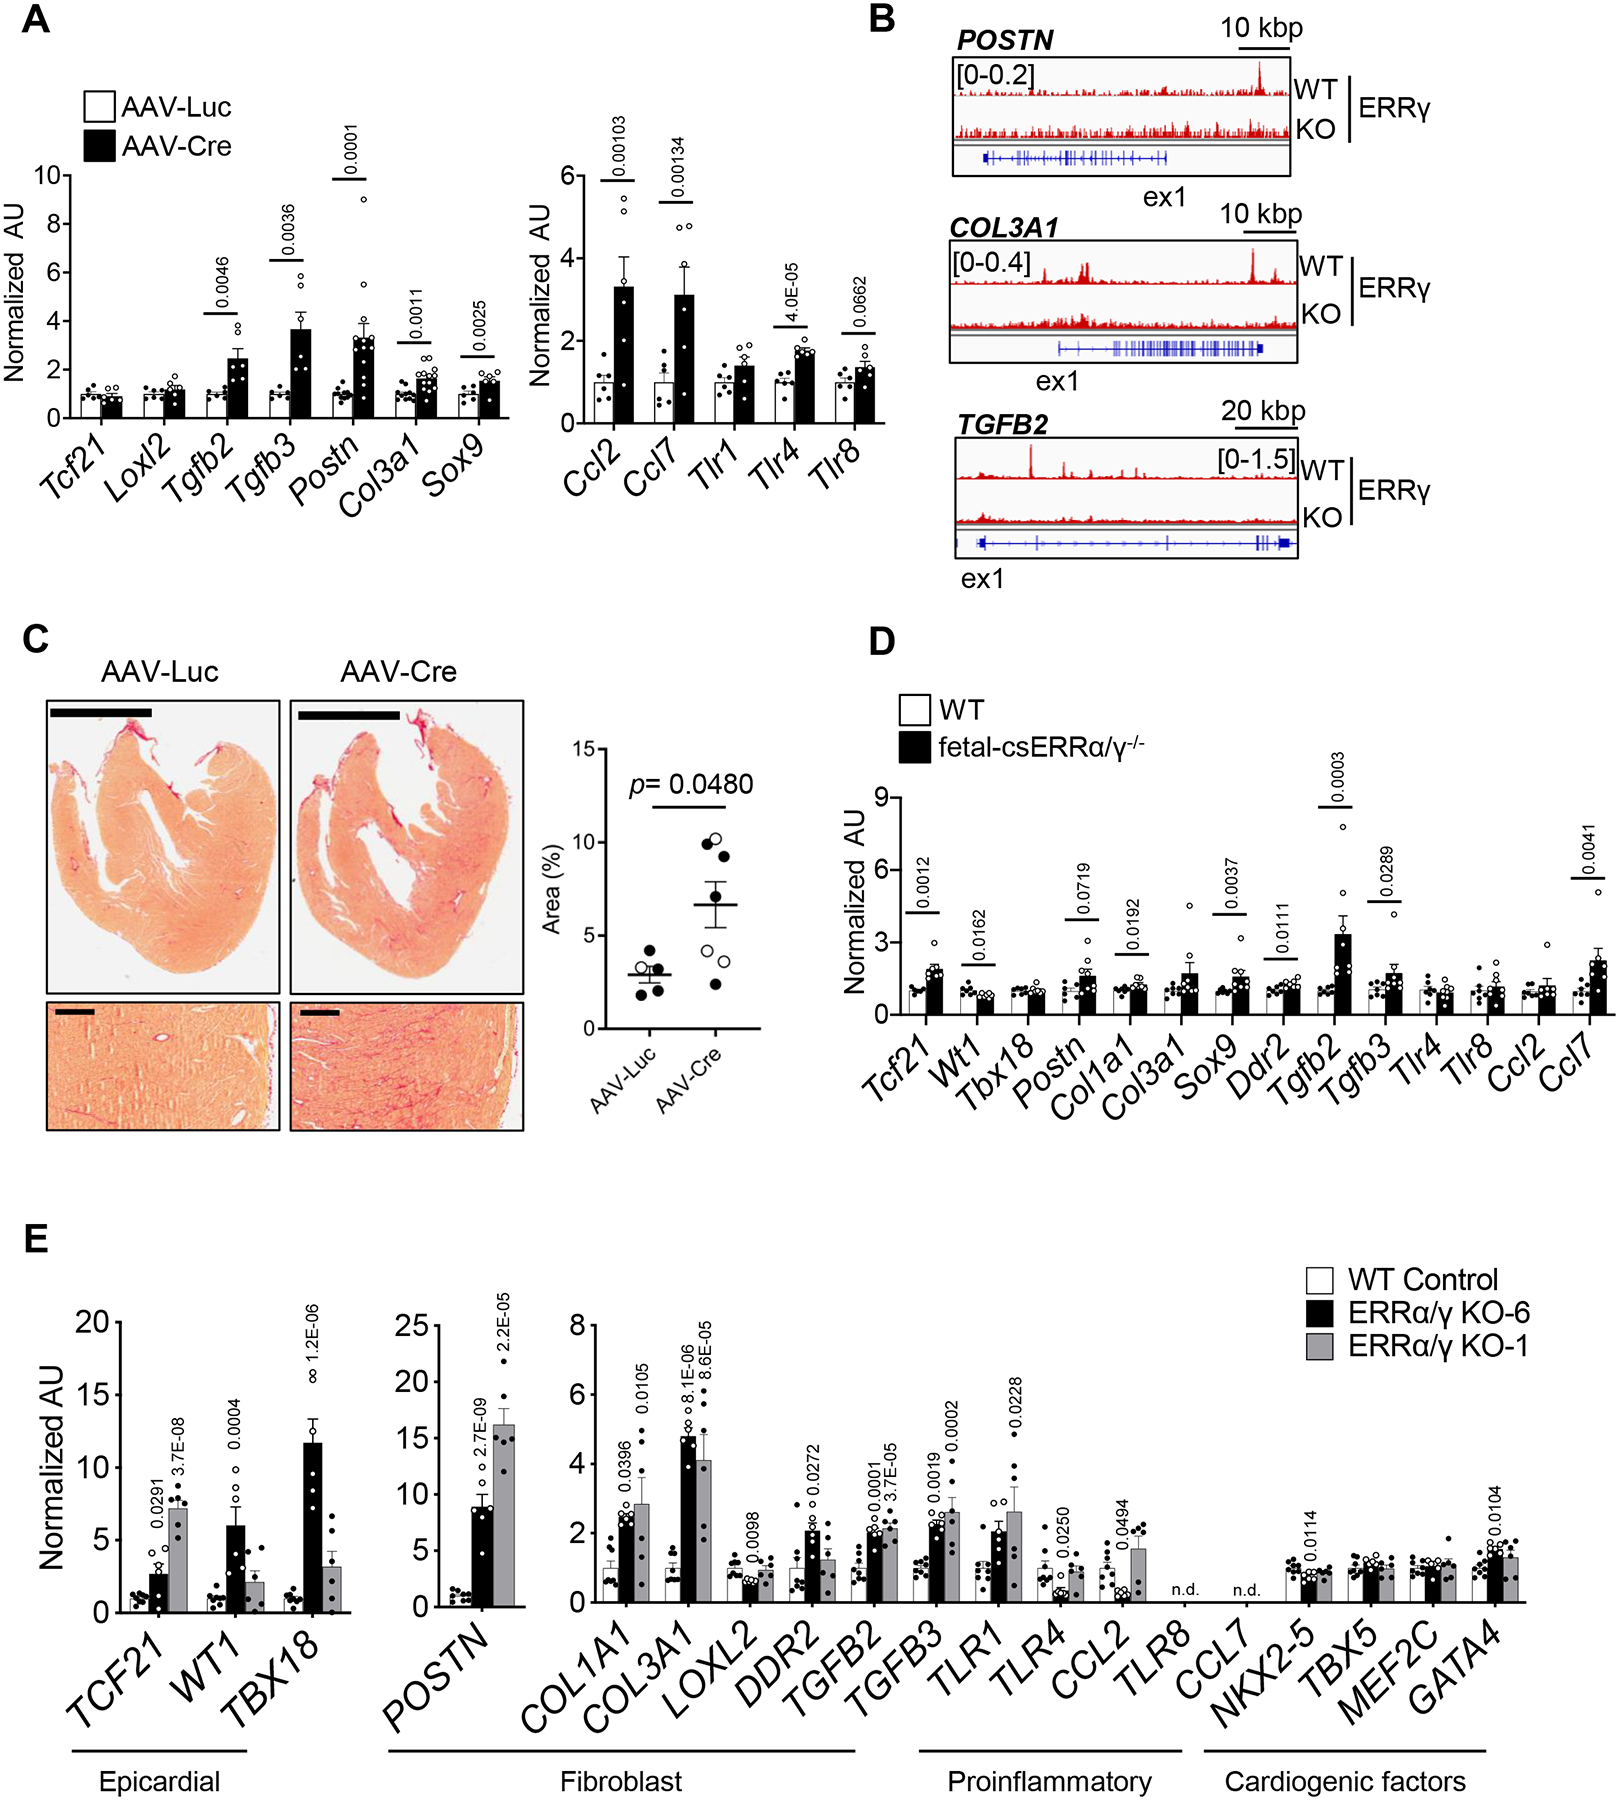
Figure 7. Loss of ERRα/γ induced fibroblast-lineage gene expression in cardiomyocytes.

(A) Levels of mRNA transcripts encoding fibroblast and proinflammatory genes determined by RT-qPCR in ventricles from male pn-csERRα/γ KD mice and AAV-Luc-injected littermate controls (n=5–11) or Cre (n=7–13)-injected ERRα/γflox/flox mice as measured by RT-qPCR. p-values are indicated on the bar graphs vs AAV-Luc. Student’s t-test or Mann-Whitney U test was used (see Detailed Methods). Bars represent the mean ± SEM. (B) Representative genome browser tracks of ERRγ peaks on the suppressed-targets in WT and ERRγ KO hiPSC- CMs. Number in brackets indicates RPM (reads per million). (C) Left: Representative images of Picro Sirius Red staining of whole ventricles and LV free wall from AAV-Luc or Cre-injected ERRα/γflox/flox . Scale bars represent 2 mm (lower magnification) and 200 mm (higher magnification). Right: Bar graphs show the amount of % of Picro Sirius Red staining in ERRα/γflox/flox ventricles subjected with AAV-Luc or AAV-Cre. Open symbol indicates female, closed symbol indicates male. Mann-Whitney U test was used. (D) Levels of transcripts of ERR suppressed-targets involved in early development including genes involved in fetal contractile machinery, epicardial development, signaling and fibroblast processes in E17.5 ventricles of control WT (n=6–7) and littermate fetal-csERRα/γ−/− (n=7–8) mice as measured by RT-qPCR. p-values are indicated on the bar graphs vs WT. Student’s t-test or Mann-Whitney U test was used (see Detailed Methods). Bars represent the mean ± SEM. (E) Levels of mRNA transcripts encoding fibroblast, epicardial, and cardiac lineage markers in WT (n=8) or ERRα/γ KO hiPSC-CMs from two distinct ERRα/γ KO hiPSC lines (KO6, KO1; n=6) as measured by RT-qPCR. p-values are indicated on the bar graphs vs WT, 1-way ANOVA with Dunnet’s multiple comparisons test. Bars represent the mean ± SEM. n.d equals non-detectable.
