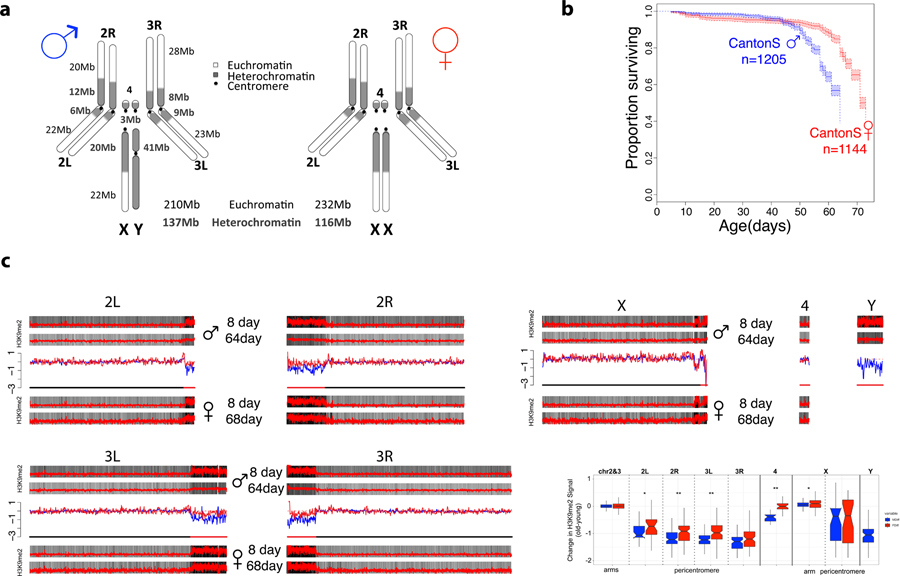
Figure 1. Aging and the sex-specific chromatin landscape in Drosophila.
A. Kaplan-Meier survivorship curves63 for Canton-S males (blue) and females (red), with the shaded region indicating the upper and lower 95% confidence interval calculated from the Kaplan-Meier curves. Karyotypes of male and female D. melanogaster are shown, with heterochromatic regions indicated in blue, and euchromatic regions in gray. The number of flies counted for each sex (n) to obtain the survivorship curves is indicated. B. Genome-wide enrichment of H3K9me2 for young (8 days) and old (64 or 68 days) D. melanogaster males and females along the different chromosome arms. Enrichment in 5kb windows is shown in red lines (normalized ratio of ChIP to input, see Materials & Methods), and the enrichment in 20kb windows is shown in gray scale according to the scale in the lower right of the panel, with the darkest gray corresponding to the highest 5% of values across all windows from all samples, and the lightest gray corresponding to the lowest 10% of values across all windows from all samples. Subtraction plots show the absolute difference in signal of 50kb windows between young and aged flies along the chromosome arms, with each sample further smoothed by subtracting out the median autosomal euchromatin signal, with females in red and males in blue, and the pericentromeric region of each chromosome indicated by the red segment of the line beneath each chromosome. C. Box plot showing the smoothed ChIP signal for all 50kb windows in different chromosomal regions (* p<0.05, ** p<1e-6, *** p<1e-12, Wilcoxon test) for males (blue) and females (red), with pericentromere boundaries defined by the Release 6 version of the D. melanogaster genome. Boxes represent 25th and 75th percentile, and whiskers show the most extreme values within 1.5x the inter-quartile range.

