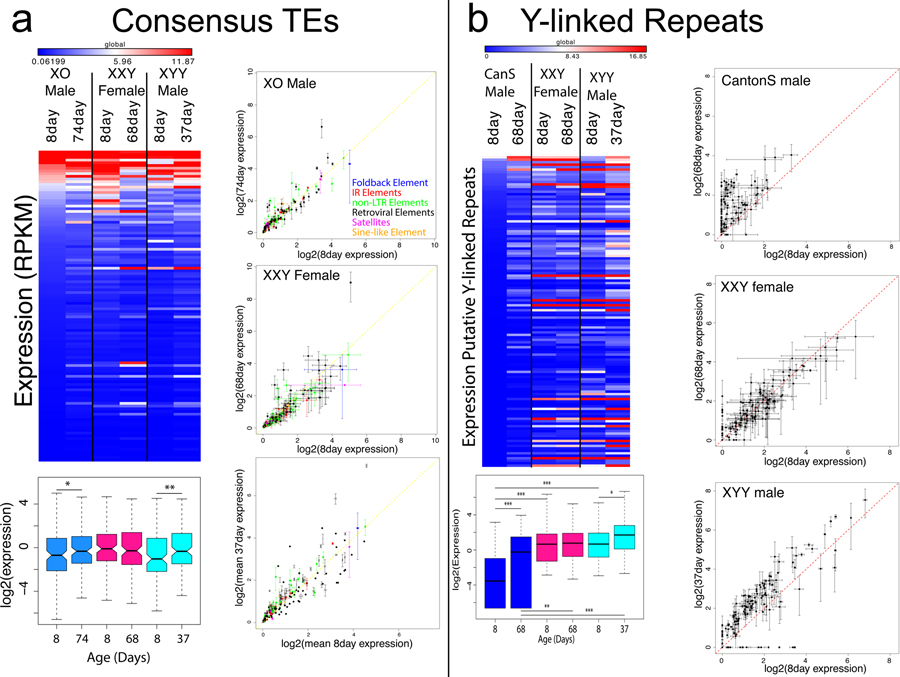
Figure 4. Expression of repetitive elements in XXY females and X0 and XYY males during aging.
A. Expression of all repeats from FlyBase consensus library from the Release 6 of the D. melanogaster genome. The heatmap shows averaged expression across replicates, with significance values calculated using a Wilcoxon test (* p<0.1, ** p<0.05, *** p<0.01). The scatterplots show expression of all repeats from the FlyBase consensus library in young and old X0 males, XXY females, and XYY males, with lines indicating the standard deviation of each expression value calculated from replicates, and color indicating the class of repetitive element. B. Expression for putatively Y-linked (male-specific) repeats in karyotypes with a Y chromosome, averaged across replicates, with significance calculated using the Wilcoxon test (* p<0.05, ** p<0.001, *** p<1e-5) Scatterplots like in (A.) for putatively Y-linked repeats. Boxes represent 25th and 75th percentile, and whiskers show the most extreme values within 1.5x the inter-quartile range.

