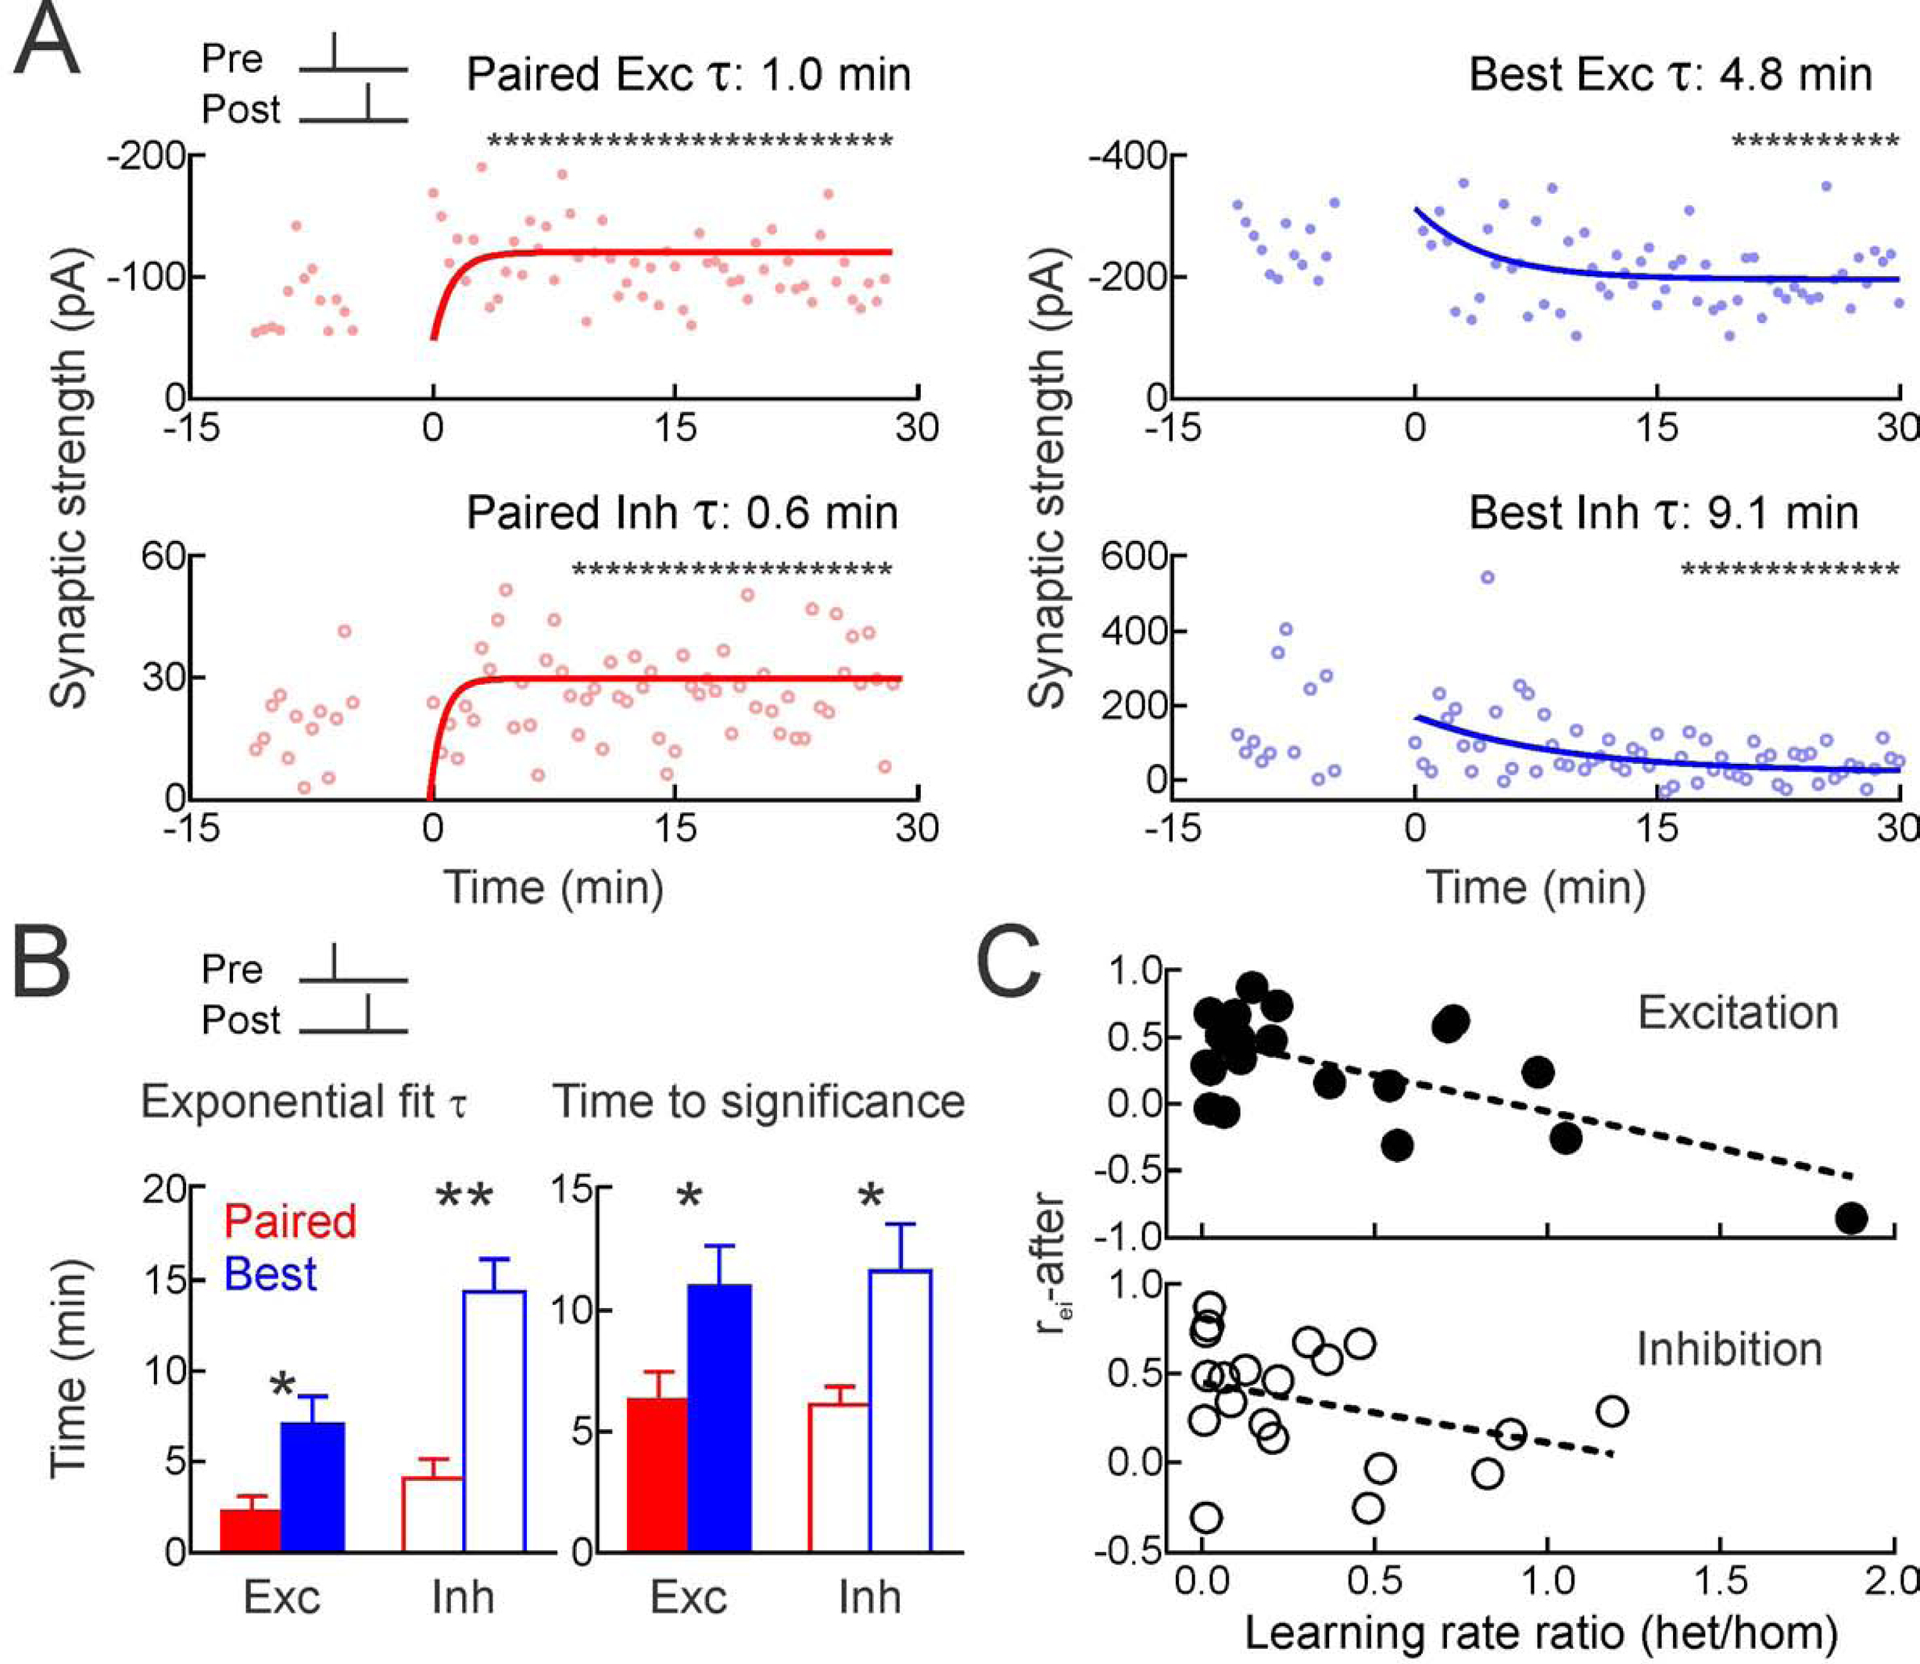
Figure 4. Heterosynaptic modifications lag changes to paired inputs.

(A) Time course of changes to paired EPSCs (top left) and IPSCs (bottom left) for cell from Figure 1, measured with single exponentials and running t-tests (asterisks, p<0.05 vs baseline) to determine when significant modifications were first expressed.
(B) Summary for paired homosynaptic (red) and original best heterosynaptic modifications (blue); exponential fits (left; paired excitation τ:2.3±0.9 min, original best excitation τ:7.0±1.6 min, p<0.02; paired inhibition τ:4.1±1.1 min, original best inhibition τ:14.4±1.8 min, p<0.001) and running t-tests (right; paired excitation:6.3±1.2 min, original best excitation:11.0±1.7 min, p<0.03; paired inhibition:6.1±0.8 min, original best inhibition:11.6±1.9 min, p<0.03).
(C) rei-after inversely correlated with ratio of heterosynaptic vs homosynaptic τs; higher rei values were associated with weaker/slower heterosynaptic plasticity, lower rei values were associated with faster heterosynaptic modifications, for excitation (r:−0.63) and inhibition (r:−0.34).
