Figure 1. VL ROI.

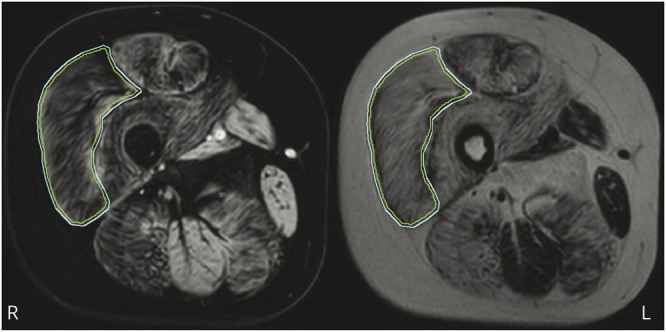
Example of a region of interest (ROI) drawn on the vastus lateralis (VL) (outer line) and the 2-mm inward erosion (inner line) on a water image (left) and corresponding fat image (right).

Example of a region of interest (ROI) drawn on the vastus lateralis (VL) (outer line) and the 2-mm inward erosion (inner line) on a water image (left) and corresponding fat image (right).