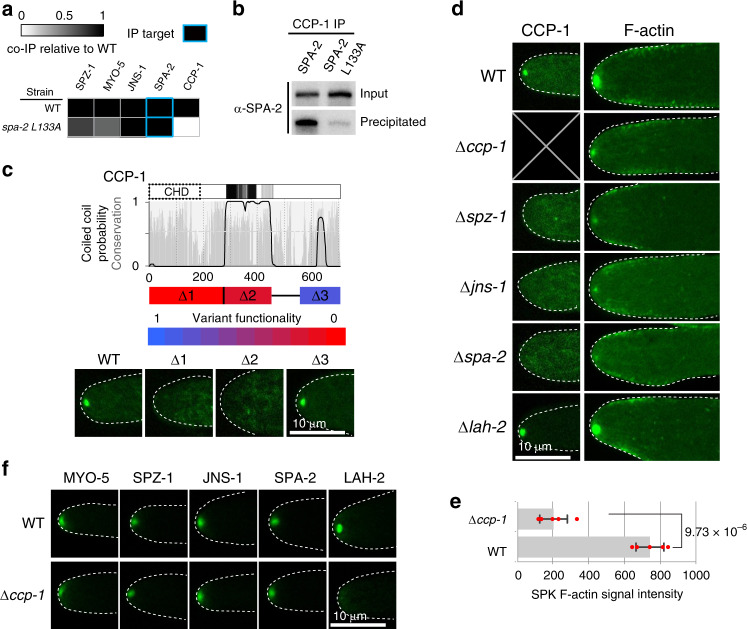
Fig. 5. Identification of the Neurospora crassa SHD binding effector CCP-1.
a The ability of the SPA-2L133A mutant to co-precipitate interacting proteins is compared to full-length SPA-2 (WT). The signal from mass spectrometry is compared to the WT precipitation according the scale shown in the legend. b CCP-1-mGFP precipitates SPA-2, but interacts weakly with the SPA-2 L133A mutant. Input and precipitated fractions are analyzed by western blotting for SPA-2. c Conservation, coiled-coil and coiled-coil dimer prediction for CCP-1. The calponin domain is boxed with a dashed line. The indicated regions of CCP-1 (r1-r3) were deleted using an mCherry-selectable marker fusion as described in Materials and Methods. Variant functionality is scored according to the color scale where 1 and 0 represent wild type and deletion mutant growth rates, respectively. Lower panels show localization of the indicated deletion variants. Dotted white lines show the hyphal outline. Scale bar = 10 μm. d CCP-1 tip-localization depends on SPZ-1, JNS-1 and SPA-2, but not LAH-2. The distribution of F-actin is shown for the indicated strains. Dotted white lines show the hyphal outline. Scale bar = 10 μm. e SPK F-actin signal intensity (arbitrary units) is quantified for wild type and ccp-1 deletion strains. Data are shown as mean values ± SD (n = 5 independent measurements shown as opaque red dots). The p-value calculated from 2-sided Student’s t-test is indicated. f LAH-2 depends on CCP-1, but other scaffold components do not. Localization of the indicated GFP-tagged proteins is shown in wild type and ccp-1 deletion mutant. Dotted white lines show the hyphal outline. Scale bar = 10 μm. Source data are provided as a Source Data file.

