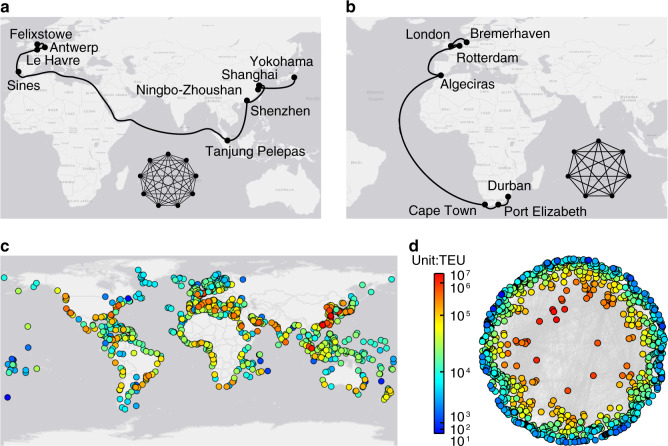
Fig. 1. Construction of the global liner shipping network.
With the information on ports of call of world’s individual liner shipping service routes, we made each service route a complete graph where any two ports in the service route were connected via an edge. By merging the complete graphs derived from all individual liner shipping service routes, we obtained the GLSN. See “Methods”, for details about the adopted data on world’s liner shipping service routes and details about the adopted network topology representation method for GLSN construction. In (a and b), we show how complete graphs are derived from individual liner shipping service routes, with two examples: an Asia-Europe service route consisting of nine ports (a) and an Africa-Europe service route consisting of seven ports (b). In (c and d), we show ports of the GLSN using a geographical map and show inter-port connections using a hyperbolic layout obtained by coalescent embedding57, respectively. The color of nodes corresponds to the traffic capacity of ports measured in Twenty-Foot Equivalent Unit (TEU). The coalescent embedding layout clearly points out that TEU gradient is related with the radial coordinate of the hyperbolic model, therefore ports with larger TEU values are more central in the hyperbolic geometry underlying the GLSN. The coalescent embedding hyperbolic layout locates at centre the nodes that are fundamental for the efficient navigability of a complex network58. As such, the observed phenomenon that ports with larger TEU are more central in the hyperbolic layout means that ports with larger TEU are fundamental for the efficient navigability of the GLSN in transporting cargoes traded worldwide. This suggests that ports’ traffic capacity measured in TEU is indeed a meaningful indicator to be associated with international trade (as we will show in the rest of the study). Source data are provided as a Source Data file.

