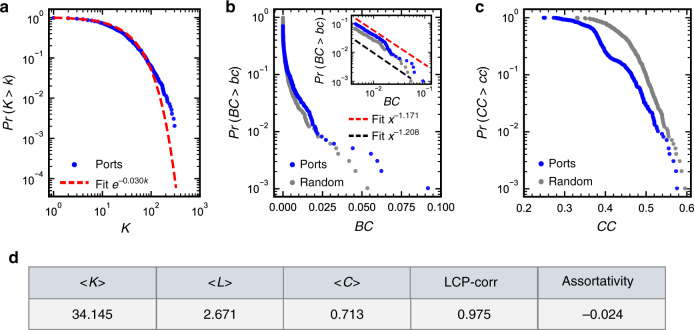
Fig. 2. Basic topological properties of the GLSN.
In (a), complementary cumulative distribution function of degree is reported in log-log scale (dots), fitted by an exponential function (dash line) instead of power-law; tests on the power-law distribution of the data failed based on the method of Clauset et al.59 and the method of Voitalov et al60 as well. Complementary cumulative probability distributions of betweenness centrality (BC) and closeness centrality (CC) for ports are plotted in semi-log scale in (b and c), respectively, in comparison to an equivalent random network which exactly keeps the same degree distribution as the original GLSN. The inset in (b) reports in log-log scale a power-law tail (red dash line) in the betweenness distribution with an exponent 1.171, corresponding to ports with BC ≥ 0.0043 (dots); power-law-ness is tested based on the method of Clauset et al.59. For an equivalent random network, the betweenness distribution for nodes with BC ≥ 0.0043 decays with an exponent 1.208 (mean across 80.4% (804 out of 1000) iterations passing the test) (black dash line). The average closeness centrality of the GLSN (i.e., 0.382) is close to that of an equivalent random graph (i.e., 0.440, mean across 1000 iterations). The bottom panel d presents the average port degree <K>, average shortest path length <L>, average clustering coefficient <C>, degree assortativity coefficient and local-community-paradigm correlation (LCP-corr). To confirm these basic topological properties of the GLSN, we repeated the analysis by using the liner shipping service routes data of 2017. The results for the GLSN of 2017 are consistent with the present results for the GLSN of 2015 (Supplementary Fig. 1). Source data are provided as a Source Data file.

