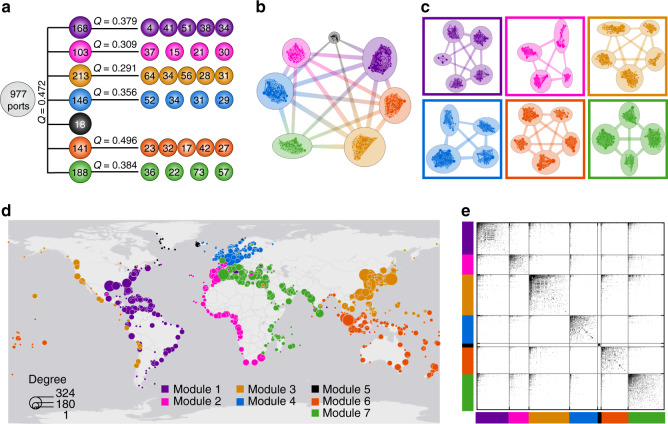
Fig. 3. Multiscale modular communities in the GLSN.
In (a–c), we give results for the division of both modular and submodular port communities. a Values of the modularity index (Q), together with the size of each module (i.e., number of ports); see “Methods” for a formal definition of Q. The network plots show the extracted modules (b) and the submodules (c); larger separation between models (submodules) is adopted to visualize the weaker connections between them, and inter-module (inter-submodule) connections are simplified. In (d and e), we show the results for the division of modular port communities. d A geographical plot presenting the seven modular communities by color. e A matrix plot presenting intra-module and inter-module links, with color black indicating a pair of ports are linked and color white unlinked; in each module ports are sorted in a descending order of degree.

