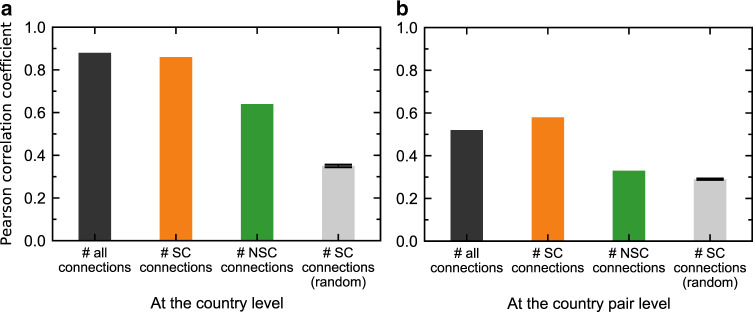
Fig. 9. Correlation between the GLSN topological indicators and international trade indicators of countries.
In (a), we show for countries the Pearson correlation coefficients between international trade value (ITV) and # all (inter-port) connections with all other countries in the world (black bar); between ITV and # SC connections (structural-core connections, those between a country’s structural-core ports and ports of other countries), yellow bar; and between ITV and # NSC connections (non-structural-core connections, those between a country’s non-structural-core ports and ports of other countries), green bar. In (b), we show for country pairs the Pearson correlation coefficients between the bilateral trade value (BTV) and # all (inter-port) connections between the two countries (black bar); between BTV and # SC connections (structural-core connections, those with at least one end-node of the connection being a structural-core port), yellow bar; and between BTV and # NSC connections (non-structural-core connections, those with two end-nodes of the connection being both non-structural-core ports), green bar. We test the statistical significance of the results reported for SC connections (yellow bars), by randomly selecting 1000 sets of ports corresponding in size to the number of ports contained in the structural core (which is 37) and repeating for each random set of ports the same analysis as we did for the detected structural core. Gray bars show the averages of 1000 random cases, and error bars report the standard errors. Source data are provided as a Source Data file.

