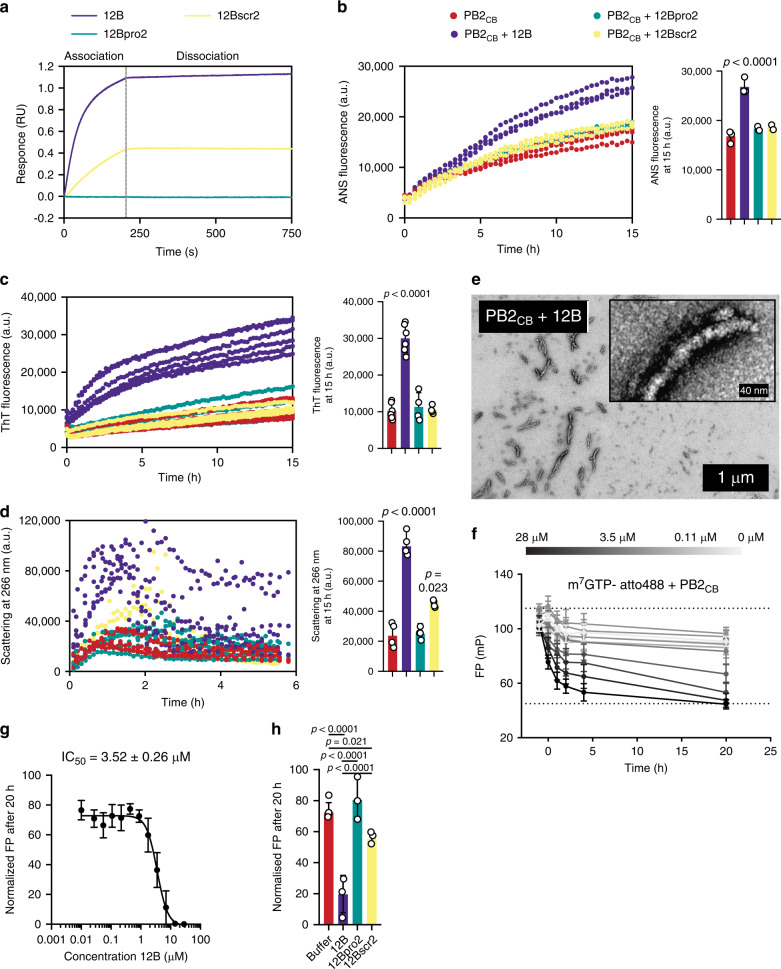
Fig. 3. Amyloid peptide 12B interacts with influenza via the PB2 target protein in vitro.
a Biolayer interferometry showing association and dissociation of 10 µM peptide to his-tagged, immobilized PBCB. b, c ANS (excitation 380 nm, emission 485 nm) and Th-T (excitation 440 nm, emission 485 nm) fluorescence of PB2CB (32 µM) with and without peptides (3.2 µM) over time. Quantification of the fluorescence signal after 15 h is shown on the right. Data are expressed as mean ± SD (n = 3 (b) and n = 6 (c) independent experiments, statistics: one-way ANOVA with multiple comparison to PB2CB alone). d Particle scattering (260 nm) of PB2CB (32 µM) with and without peptides (3.2 µM) over time. Quantification of scattering signal after 1 h (before precipitation) is shown on the right. Data are expressed as mean ± SD (n = 4 independent experiments, statistics: one-way ANOVA with multiple comparison to PB2CB alone). e TEM images of PB2CB (32 µM) with peptide 12B (3.2 µM) after 15 h incubation. f Binding of m7GTP-atto488 by PB2CB in absence or presence (gray scale for peptide concentration) of a twofold serial dilution of peptide 12B, determined by fluorescence polarization (FP). Mean ± SD is shown (n = 4 independent experiments). The dashed lines represent maximal binding of m7GTP-atto488 to PB2 (upper dashed line) and free m7GTP-atto488 (lower dashed line), based on control experiments (Supplementary Fig. 4h). g Concentration-dependent effect of peptide 12B on the binding of m7GTP-atto488 by PB2CB (5 µM) after 20 h incubation as shown by FP. Data represent normalized values (maximal binding = 100% and free m7GTP-atto488 = 0%) and mean ± SD is shown (n = 5 independent experiments). h Binding of m7GTP-atto488 by PB2CB (5 µM) with or without peptides (7 µM) after 20 h incubation. Data represent normalized values (similar as in g) and mean ± SD is shown (n = 3 independent experiments, statistics: one-way ANOVA with multiple comparison).

