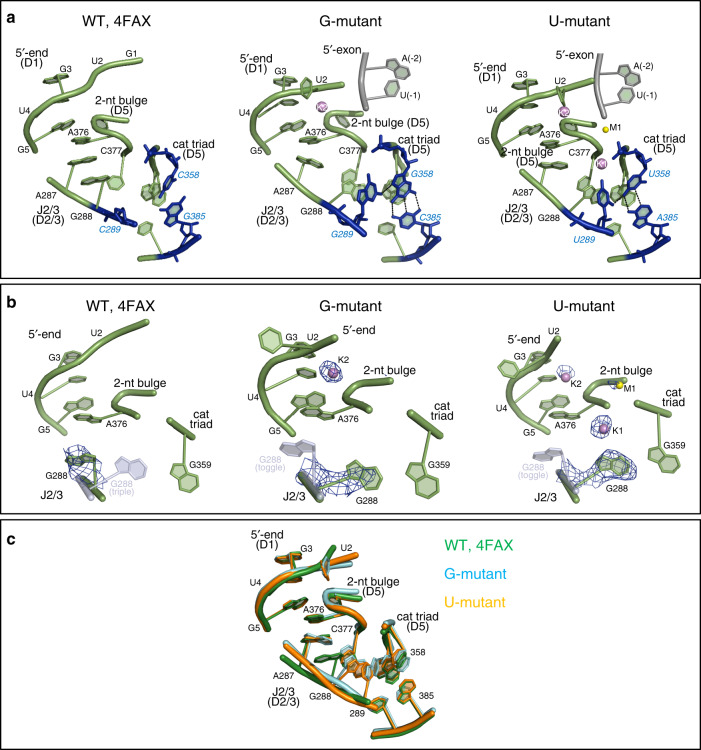
Fig. 3. Crystal structures of the intron in sodium and magnesium.
a From left to right: Active site of wild type (WT; PDB id: 4FAX), G-mutant, and U-mutant. Active site elements are depicted as in Fig. 2a. b Fo − Fc simulated-annealing electron density omit-maps calculated by omitting J2/3 residues (nt 287–289) and the M1–M2–K1–K2 metal cluster from each of the structures depicted in (a). Positive electron density peaks within 3 Å from the omitted atoms are depicted as blue mesh at a contour level of 3 σ. For the wild-type structure (left), the triple helix conformation of G288 is depicted as semi-transparent light blue cartoon representation, the M1–M2 metals as semi-transparent yellow spheres, and the K1–K2 metals as semi-transparent violet spheres (all using coordinates from PDB id: 4FAR). Analogously, the toggled conformation of G288 and unresolved metals of the cluster are depicted as semi-transparent representations for the G- and U-mutant (middle and right panels, using coordinates from PDB id: 4FAX for G288 and 4FAR for unresolved metals). c Superposition of the active sites of the structures depicted in (a).

