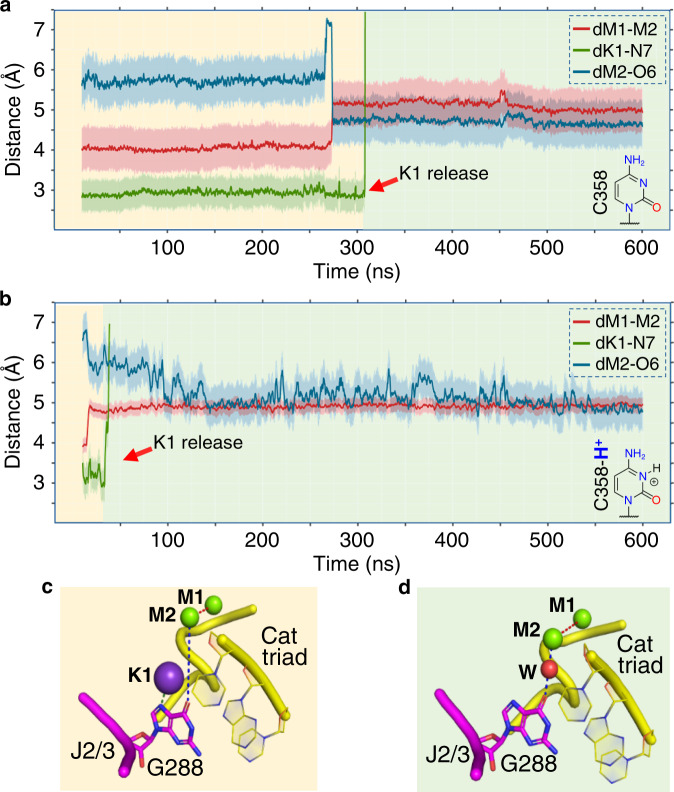
Fig. 5. Protonation of N3C358 favors K1 release.
Evolution of dM1–M2 (red trace), dK1–N7 (green trace), and dM2-O6 (blue trace) over the course of MD simulations of: a the cleaved state, and b the cleaved-H+ state. Shading around the traces indicates the s.d. of the corresponding distance Schematic structures of non-protonated and protonated cytidine groups are depicted in the bottom right of each panel. K1 is released after ~300 ns and ~40 ns from the two states, respectively (red arrow). c Structure of the active site at the beginning of the simulations after the formation of K1–N7G288. d Structure of the active site at the end of the simulations, after K1 release. K1 is released after the solvation of the active site (water molecule depicted as a red sphere, W).

