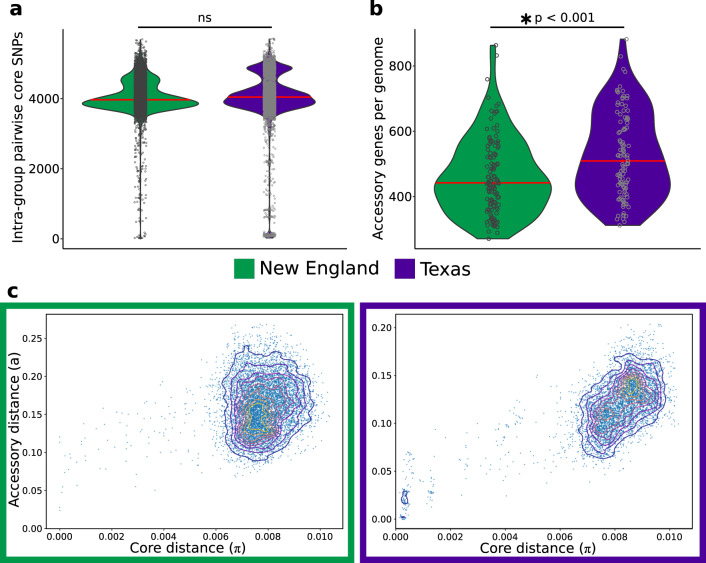
Fig. 3. Pan-genome differences between New England (n = 126 genomes) and Texas (n = 107 genomes) populations.
a Pairwise core SNPs. b Number of accessory genes per genome. Red horizontal lines represent median values. c Contour plots of pairwise distances between genomes in terms of their core genome divergence (measured by SNP density across the core genome) and the difference in their accessory genomes (measured by the Jaccard distance based on the variation in the gene content of their sequences).

