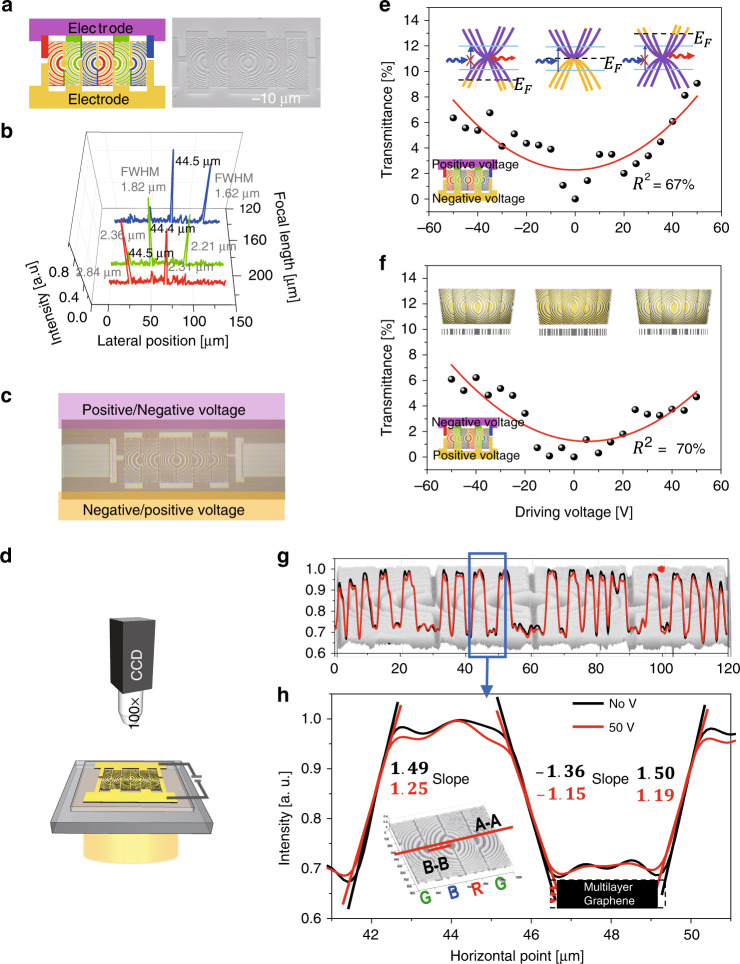
Fig. 5. Transmittance and intensity profile for the tuneable focal length ETF-USSL.
a Layout of the FIB treatment, and SEM image of the USSL array with additional electrodes (magenta and yellow) based on the packed pattern. b Variation in the focal length and distribution of beam intensities (FWHM of red USSL 2.84 μm/2.31 μm, FWHM of green USSL 2.36 μm/2.21 μm, and FWHM of blue USSL 1.82 μm/1.62 μm) at the focal length (210 μm/190 μm/140 μm for the red/green/blue USSL, respectively) for the wavelength-dependent design (218 μm/190 μm/154 μm for the red/green/blue USSL, respectively). c Optical image of the USSL array with electrodes (magenta and yellow) for application of a DC voltage bias (positive and negative voltage) for focal length modification by an electric potential. The 2D and 3D intensity distributions of the USSL were measured by d a 100× optical microscope under an applied DC voltage bias. Experimental results of e the transmittance when positive voltages are applied to the upper electrode (magenta), and negative voltages are applied to the lower electrode (yellow) and f vice versa. The coefficients of determination (R2) of the red curves in e and f are 67 and 70%, respectively. The transmittance of the USSL is the lowest near 0 V, but much greater at −50 V or +50 V. Difference in the absolute slopes of the intensity profile with an applied DC voltage bias (no voltage (black line) and 50 V (red line)), resulting from the size effect of the arc ribbon due to light transmission for the USSL, in g section A–A, which consists of green–blue–red–green USSLs with a length of 120 μm, and h section B–B with a length of 10 μm. The absolute slopes of section B–B are shown in h. The absolute slopes are low, and the edge intensities of the multilayer graphene pattern are high in the enlarged area

