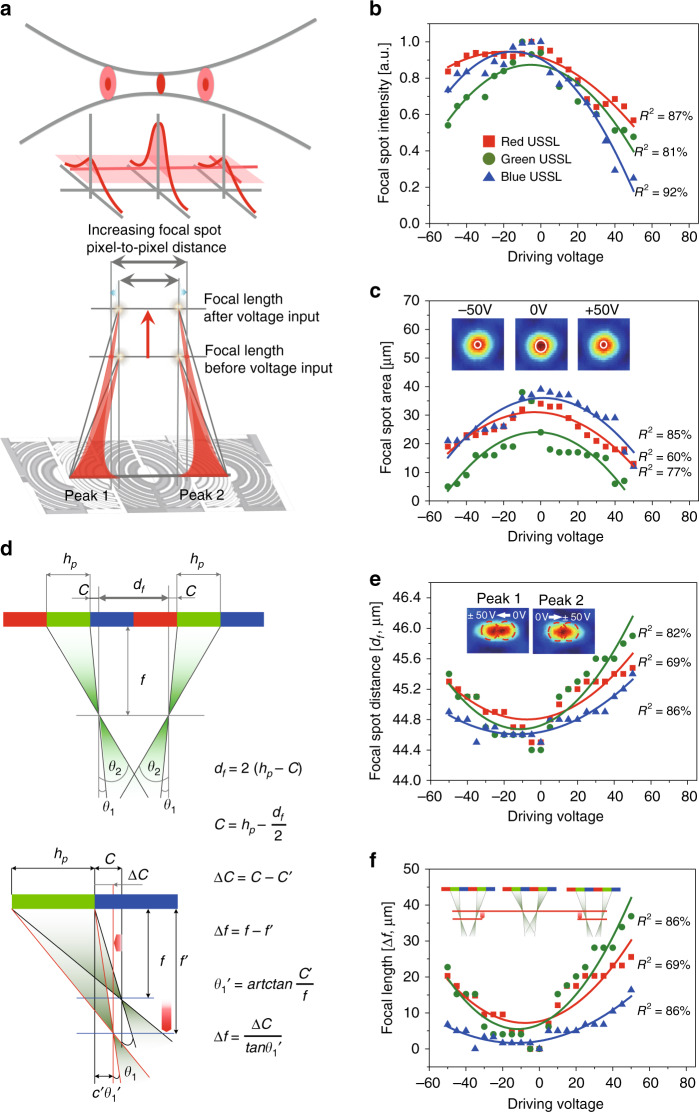
Fig. 6. Focal spot characteristics with focal length variation of the ETF-USSL.
Schematics of the focal point shift with application of an electric field: a the spot intensity depends on the distance along the z-axis and the distance in the lateral direction between the focal spots of peaks 1 and 2. At a fixed focal length position, the maximum intensity of the focal spot decreases as the focal length of the USSL becomes longer owing to the driving voltage. Experimental results of b the intensity variation at the focal point and c the spot size. As the driving voltage increases or decreases from 0 V to ±50 V, the focal length increases and the intensity of the focal spot decreases; thus, the spot size with maximum intensity also decreases. The images in graph c show that the maximum intensity is lower at ±50 V than at 0 V. d Formula for calculating the focal length (Δf) by varying the focal spot distance (df). e The focal spot distance (df) is the distance between the two peaks at the focal length, with the lowest distance near 0 V, which gradually increases for positive and negative voltages. The peak 1 and peak 2 images on the graph show the behaviour of the focal spots of the left and right green USSLs, when the driving voltage increases from 0 V to ±50 V. The peak 1 focal spot moves from right to left, and peak 2 moves from left to right. The focal spot distance (df) at a fixed focal plane increases when the focal length of the ETF-USSL increases. f The focal length shift (Δf) is calculated based on the focal spot distance. As the voltage increases or decreases from 0 V, the focal length increases, with the change in the green focal length the largest among the three. Eventually, the focal length changes as shown on the graph, indicating changes in the FOV. In b, c, e, and f, R2 is the coefficient of determination for the red, green, and blue curves

