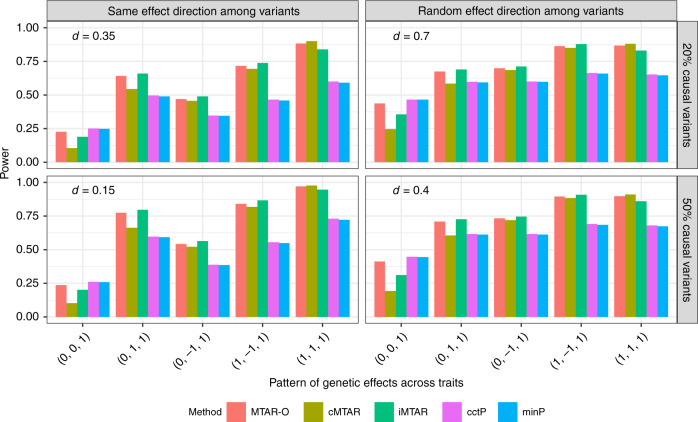
Fig. 5. Power comparisons of MTAR-O, cMTAR, iMTAR, cctP, and minP.
Each bar represents the empirical power for a method estimated as the proportion of P-values < 2.5 × 10⁻⁶ based on 104 replicates. The percentage of causal variants is set to be 20% or 50%, which corresponds to the two rows. The left column assumes the effects of the causal variants have the same direction, whereas the right column assumes the effect directions are randomly determined with an equal probability. The effect sizes (|βkj|’s) of the causal variants have a decreasing relationship with MAF as |βkj| = d|log10 MAFj|, where the constant d depends on the percentage of causal variants and the direction of their effects (the value of d is presented in each subfigure). For each configuration in a subfigure, five patterns of among-trait effects are considered.

