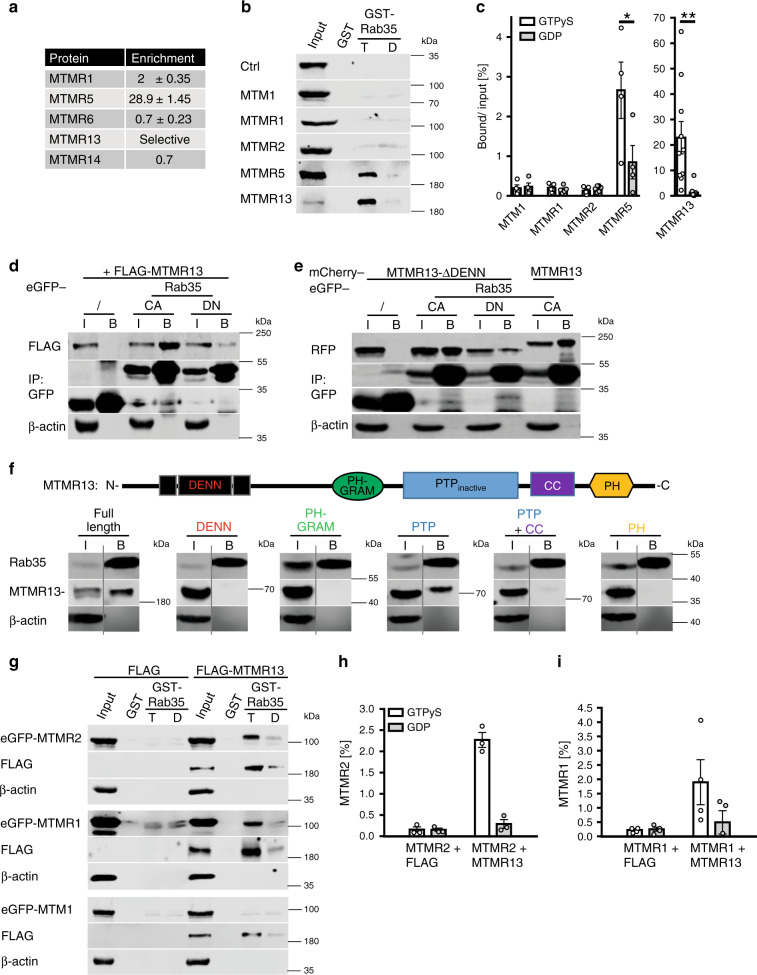
Fig. 1. Complex formation of Rab35-GTP with active MTMR lipid phosphatases.
a BioID screen for Rab35 interacting proteins. Enrichment (BirA*-Rab35/BirA* LFQ ratio) of MTMR protein-derived peptides from two independent experiments (mean ± SD). b, c Pulldown from lysates of HEK293T cells overexpressing eGFP (ctrl) or the indicated eGFP-tagged MTMRs with immobilized GST-Rab35•GTPγS (T) or GDP (D). b Representative immunoblots for eGFP or FLAG (MTMR13). Input: 5 % (MTM1, MTMR1, MTMR2, MTMR5), 6 % (ctrl), 3 % (MTMR13) of total protein added. c Quantification of representative data in b. Bound protein/input is shown. Two-tailed paired Student’s t-test of proteins bound to Rab35•GTP vs. GDP (n = independent experiments): MTM1: n = 4, p = 0.0892, t = 2.48, df = 3; MTMR1: n = 5, p = 0.2314, t = 1.41, df = 4; MTMR2: n = 7, p = 0.0712, t = 2.189, df = 6; MTMR5: n = 4, *p = 0.0191, t = 4.618, df = 3; MTMR13: n = 10, **p = 0.0048, t = 3.712, df = 9. d Affinity capture of eGFP-Rab35 GTP (CA, constitutively active) or GDP (DN, dominant-negative/inactive) locked mutants from lysates of FLAG-MTMR13-overexpressing HEK293T cells. Immunoblot analysis for eGFP, FLAG, or β-actin of input (I) and bound (B) fractions. Ratio of FLAG-MTMR13 bound to CA/DN is 11.6. IP immunoprecipitation. Input (I): 3.5% of total protein. e Same as in d but with MTMR13-ΔDENN. d, e are representative of two independent experiments. f Top, MTMR13 domain organization. Bottom, affinity capture of endogenous eGFP-Rab35 from KI HeLa cells expressing full-length MTMR13 or the indicated MTMR13-domains analyzed by immunoblotting as in d. Input (I): 4% (PH-GRAM, PTP), 3% (DENN, PTP + CC), 1.5% (Full length, PH) of total protein. Representative of two independent experiments. g–i Pulldown from lysates of HEK293T cells co-expressing eGFP-MTM1, -MTMR1, or -MTMR2, and FLAG-MTMR13 or FLAG using immobilized active GST-Rab35•GTP. g Representative immunoblot as in d. Input: 5% of total protein. h, i Quantification of representative data in g. Bound protein/input is shown. n = 3 (MTMR2) or 4 independent experiments. Data are mean ± SEM. See Source Data file for numerical source data and unprocessed blots.

