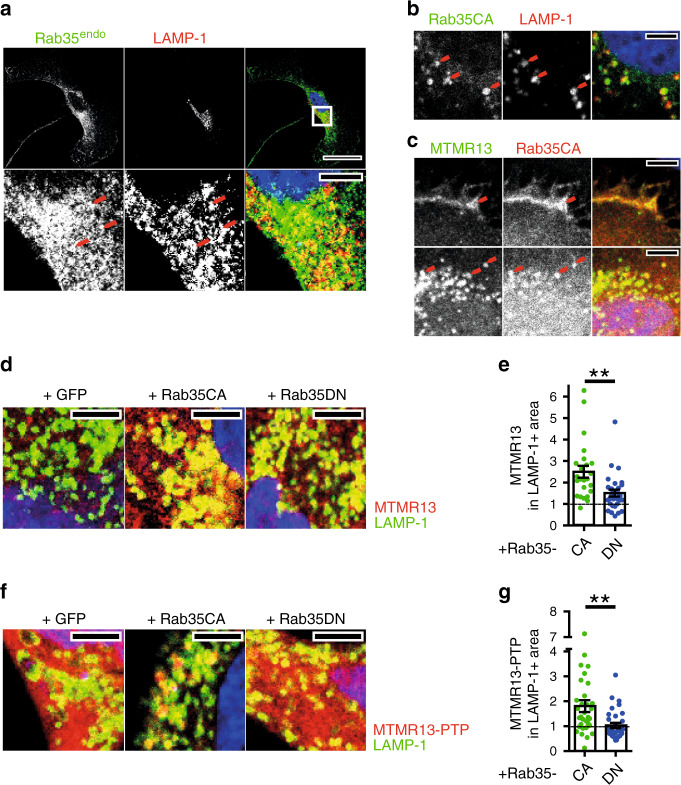
Fig. 2. Rab35 can recruit MTMR13 to late endosomes/lysosomes.
a Partial localization of endogenous eGFP-Rab35endo (green) at lysosomes (LAMP1, red) HeLa cells. Top, white square delineates magnified area (bottom). Red arrows, colocalizing puncta. DAPI (blue), cell nuclei. Scale bars, 30 μm (top), 5 µm (bottom). Representative of 14 cells. b, c Representative confocal images of HeLa cells expressing constitutively active eGFP-Rab35 (Rab35CA) and FLAG- MTMR13 alone or combined and immunostained for eGFP, LAMP-1, and FLAG. DAPI (blue), cell nuclei. Red arrows, colocalizing puncta. Scale bars, 5 µm. b eGFP-Rab35•GTP (Rab35CA) (green) localizes to perinuclear LAMP-1 (red)-positive puncta. Representative of two independent experiments. c MTMR13 (green) colocalizes with eGFP-Rab35•GTP (Rab35CA) (red) at the plasma membrane (top) and in perinuclear puncta (bottom). d, e MTMR13 is cytosolic but localizes to late endosomes/lysosomes in the presence of active Rab35•GTP. n = 5 independent experiments. d Representative images of HeLa cells co-expressing FLAG-MTMR13 with eGFP, constitutively active eGFP-Rab35•GTP (Rab35CA) or dominant-negative eGFP-Rab35•GDP (Rab35DN). Cells were immunostained for eGFP (see Supplementary Fig. 2c), LAMP-1 (green) and FLAG (red). DAPI (blue), cell nuclei. Scale bars, 5 µm. e Quantification of representative images shown in d. Mean intensity of MTMR13 in LAMP1-puncta was normalized to MTMR13-expression and set to 1 under control conditions (+eGFP). Data are from n = 24 (Rab35CA) and 29 (Rab35DN) cells in four independent experiments. Two-tailed Student’s t-test with a theoretical mean of 1, **p = 0.0022, t = 3.227, df = 51. f, g Representative images of HeLa cells co-expressing mCherry-MTMR13-PTP with eGFP, eGFP-Rab35•GTP (Rab35CA), or eGFP-Rab35•GDP (Rab35DN) (f). Cells were immunostained for eGFP (see Supplementary Fig. 2d), LAMP-1 (green) and mCherry (red). DAPI (blue), cell nuclei. Scale bars, 5 µm. g Quantification (as described in e) of representative images shown in f. Data are from n = 32 (Rab35CA) and 31 (Rab35DN) cells in four independent experiments. Two-tailed Student’s t-test with a theoretical mean of 1, **p = 0.0044, t = 2.957, df = 61. All data represent mean ± SEM. Numerical source data are reported in the Source Data file.

