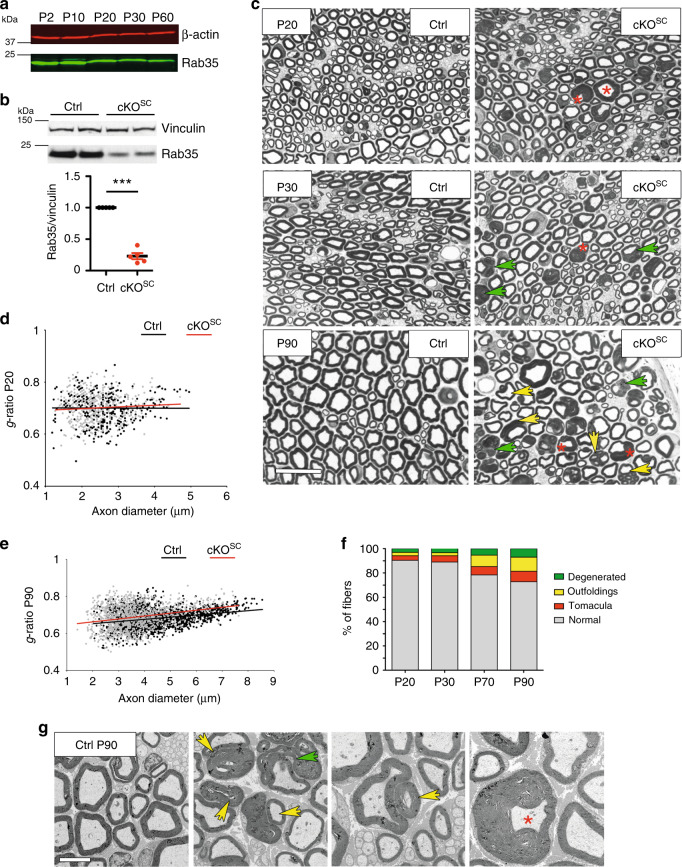
Fig. 3. Loss of Rab35 in Schwann cells causes focal hypermyelination.
a Postnatal Rab35 expression in sciatic nerves. Represenative of two independent experiments. b Reduced Rab35 levels in sciatic nerve lysates from Rab35 cKOSC mice at P30 compared to controls (Ctrl) set to 1. One-sample two-sided t-test, n = 5 pools of nerves per genotype in three independent experiments, p = 0.0001, t = 15.52, df = 4. Residual Rab35 is from fibroblasts and axons. c Semithin section analysis of control and Rab35 cKOSC sciatic nerves at P20, P30, and P90. Red asterisks, examples of tomacula or increased myelin thickness. Yellow arrowheads, myelin outfoldings. Green arrowheads, myelin degenerations. Representative images for quantifications in f. d g-ratio at P20: Rab35 cKOSC, 0.7 ± 0.005, 404 fibers; controls (Rab35flox/flox and Rab35flox/+), 0.7 ± 0.0024, 432 fibers, n = 5 mice/genotype, p = 0.69. e g-ratio at P90: Rab35 cKOSC, 0.688 ± 0.002, 1162 fibers; controls (Rab35flox/+), 0.682 ± , 0.002, 1499 fibers, n = 4 mice, p = 0.057. Fibers >5 µm in diameter: Rab35 cKOSC, 0.73271374 ± 0.005, 130 fibers and control (Rab35flox/+), 0.700473046 ± 0.0045, 446 fibers, n = 4 mice, p = 0.0286. d, e Two-tailed nonparametric Mann–Whitney test. f Myelinated fibers with aberrant myelin (in percentage of total): Rab35 cKOSC at P20, n = 5 mice, percentage of Myelin degeneration: 3.053 ± 0.272. Tomacula: 3.684 ± 0.164. Myelin outfoldings: 2.829 ± 0.313; at P30, n = 4 mice, Myelin degeneration: 3.348 ± 0.221. Tomacula: 5.109 ± 0.508. Myelin outfoldings: 2.548 ± 0.136; at P70, n = 7 mice. Myelin degeneration: 5.390 ± 0.472. Tomacula: 6.916 ± 0.389. Myelin outfoldings: 9.336 ± 1.008, and at P90, n = 4 mice. Myelin degeneration: 6.993 ± 0.572; tomacula: 8.553 ± 0.676. Myelin outfoldings: 11.619 ± 0.588. g Representative images of ultrastructural analysis of control and Rab35 cKOSC sciatic nerves (middle, right) at P90 quantified in f. Red asterisk, tomacula. Yellow arrowheads, myelin outfoldings. Green arrowhead, example of myelin degeneration. Mean ± SEM. Bar in c for P20, P30, and P90 semithin sections is 20 µm. Bar in g is 5 µm and 3.5 µm (for the outfolding and tomacula details). Numerical source data and unprocessed blots are reported in the Source Data file.

