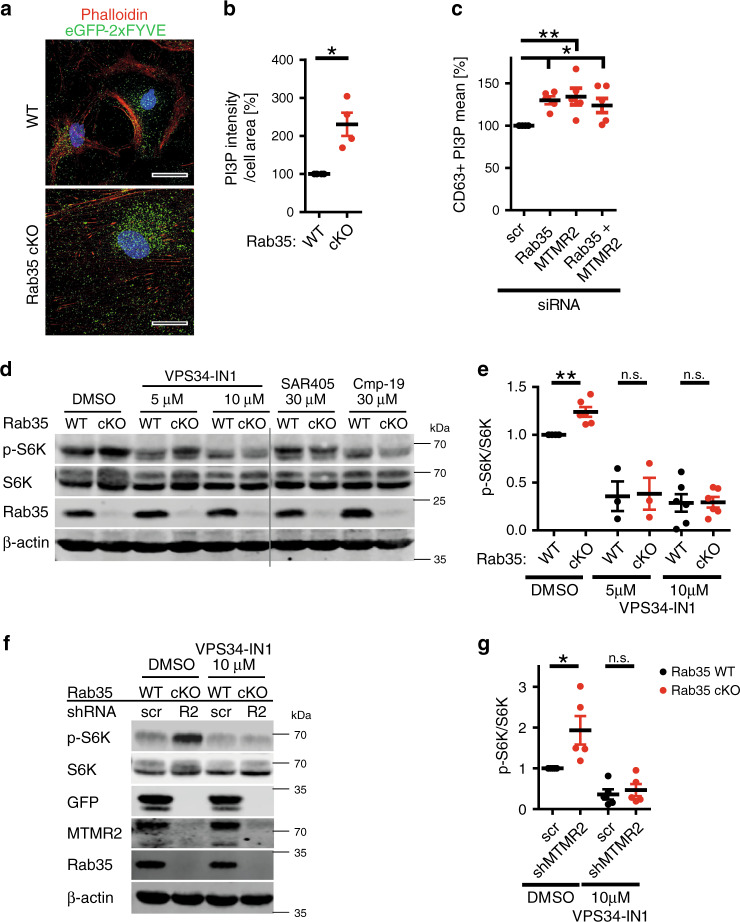
Fig. 9. Inhibition of PI 3-phosphate synthesis rescues mTORC1 hyperactivity.
a Representative images of astrocytes from Rab35flox/flox cKO or non-CreER-expressing Rab35flox/flox control mice (WT) stained for PI(3)P (green) and F-actin (red). Blue, DAPI-stained nuclei. Scale bar, 30 µm. b Quantification of representative data in a from n = 4 independent experiments. Data for WT were set to 100%. One sample two-tailed Student’s t-test with a theoretical mean of 100, *p = 0.0237, t = 4.264, df = 3. c PI(3)P levels in HeLa cells depleted of Rab35 and/or MTMR2 normalized to scrambled (scr) controls. See images in Supplementary Fig. 7c. Mean PI(3)P intensity (% of scr control) in CD63+ -compartments from n = 5 independent experiments. One-way ANOVA followed by Dunnett’s Multiple Comparison Test: Rab35 siRNA: q = 3.328, MTMR2 siRNA: q = 3.827, Rab35 siRNA + MTMR2 siRNA: q = 2.982, *p = 0.01, df = 4. d Lysates from Rab35 cKO astrocytes treated with DMSO, VPS34-IN1, SAR405, or Compound-19 (Cmp-19) were immunoblotted for Rab35, total S6K, p-S6K, and β-actin. e Quantification of representative data shown in d. p-S6K/S6K ratio (WT with DMSO set to 1). One sample two-tailed Student’s t-test with theoretical means of 1; n = number of independent experiments: DMSO: n = 6, **p = 0.0053, t = 4.701, df = 5; 5 µM VPS34-IN1: n = 3, p = 0.1374, t = 2.411, df = 2; 10 µM VPS34-IN1: n = 6, p = 0.3368, t = 1.062, df = 5. n.s. non-significant. f, g Astrocytes from Rab35flox/flox cKO or non-CreER-expressing Rab35flox/flox control mice (WT) transduced with lentiviruses encoding scr or anti-MTMR2 shRNA were treated with DMSO or 10 µM VPS34-IN1 before analysis. f Representative immunoblots for p-S6K, S6K, eGFP (scr), MTMR2, Rab35, and β-actin. g Quantification of representative data shown in f from n = 5 independent experiments. p-S6K/S6K ratio (scr-WT astrocytes+DMSO set to 1). Paired one-tailed Student’s t-test; DMSO: *p = 0.021, t = 2.948, df = 4; VPS34-IN1: p = 0.2114, t = 0.8920, df = 4. n.s. non-significant. Data represent mean ± SEM. Source Data file for numerical source data and unprocessed blots.

