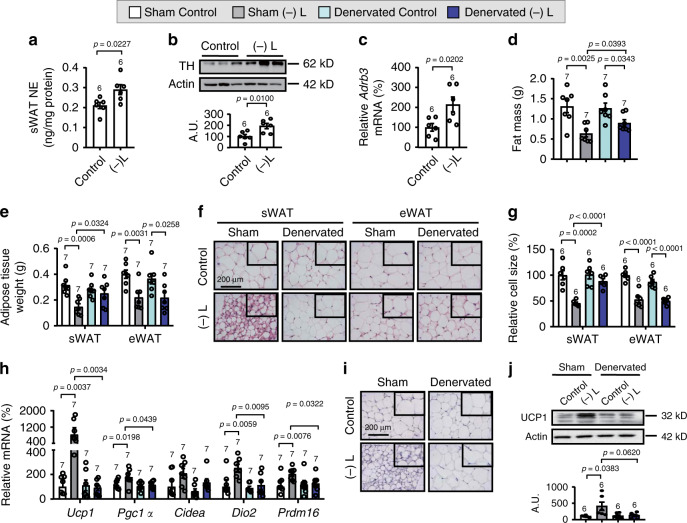
Fig. 6. Sympathetic denervation in sWAT blocks leucine deprivation-induced WAT browning.
a Norepinephrine (NE) levels in subcutaneous WAT (sWAT) measured by ELISA kit. b Tyrosine hydroxylase (TH) proteins in sWAT by western blotting (top) and quantified by densitometric analysis (bottom); A.U.: arbitrary units. c Gene expression of Adrb3 in sWAT by RT-PCR. d Fat mass by NMR. e Adipose tissue weight. f Representative images of hematoxylin and eosin (H&E) staining of sWAT and epididymal WAT (eWAT). g Cell size quantified by Image J analysis of H&E images. h Gene expression of Ucp1, Pgc1a, Cidea, Dio2, and Prdm16 in sWAT by RT-PCR. i Representative images of immunohistochemistry (IHC) of UCP1 in sWAT. j UCP1 protein in sWAT by western blotting (top) and quantified by densitometric analysis (bottom). Studies for a–c were conducted using 14- to 15-week-old male wild-type (WT) mice fed a control (Control) or leucine-deficient [(-) L] diet for 3 days; studies for d–j were conducted using 12-week-old male WT mice with sham operated (Sham) or denervated (Denervated) fed a Control or (-) L diet for 3 days. Data are expressed as the mean ± SEM (n represents number of samples and are indicated above the bar graph), with individual data points. Data were analyzed by two-tailed unpaired Student’s t test for a–c, or one-way ANOVA followed by the SNK (Student–Newman–Keuls) test for d–j. Source data are provided as a Source data file.

