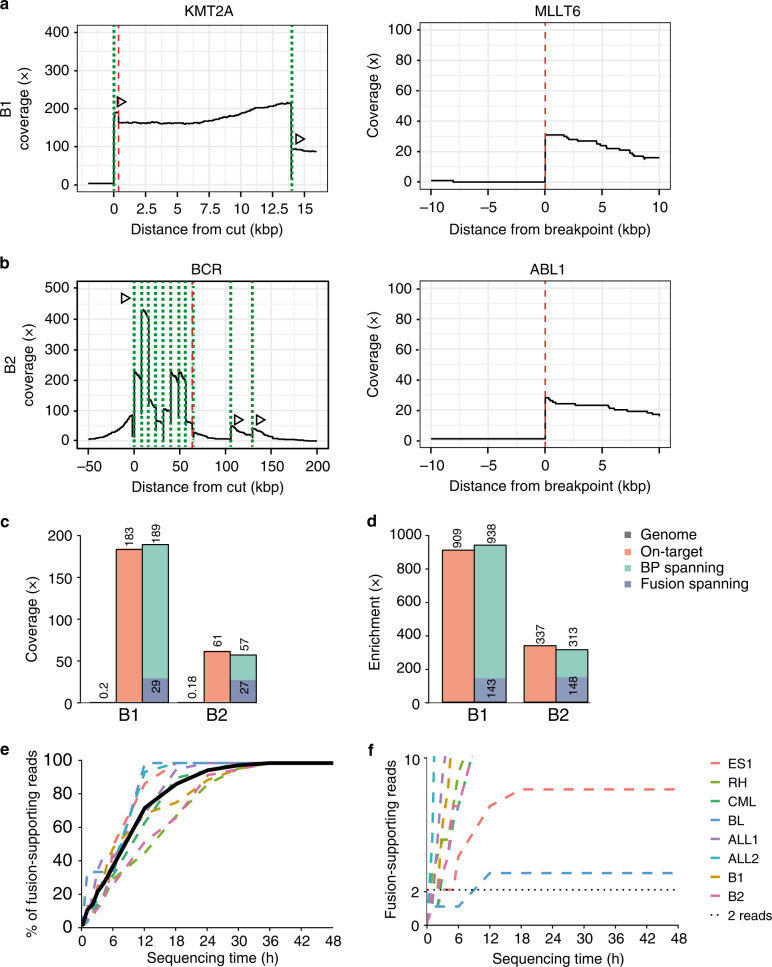
Fig. 5. Fusion gene coverage and enrichment from blinded samples and run-time analysis.
a Coverage plots for the B1 tumor sample for the two fusion partners KMT2A (targeted) and MLLT6. b Coverage plots for the B2 tumor sample for the two fusion partners BCR (targeted) and ABL1. BCR was targeted with eleven sequential guides to span the possible breakpoint region. Dotted lines (green) indicate the crRNA-directed Cas9 cleavage positions and dashed lines (red) indicate breakpoint positions. Arrows indicate the directionality of reads created from the specific crRNA design. c Mean coverage and d mean enrichment across the genome, on-target (from cut to breakpoint), BP-spanning (breakpoint-spanning), and fusion-spanning (across the fusion junction) for the tumor samples B1 and B2. e Time-course experiment on sequencing time necessary to identify fusion-spanning reads (%) and f fusion-spanning reads (n = 2). Source data are provided as a Source Data file.

