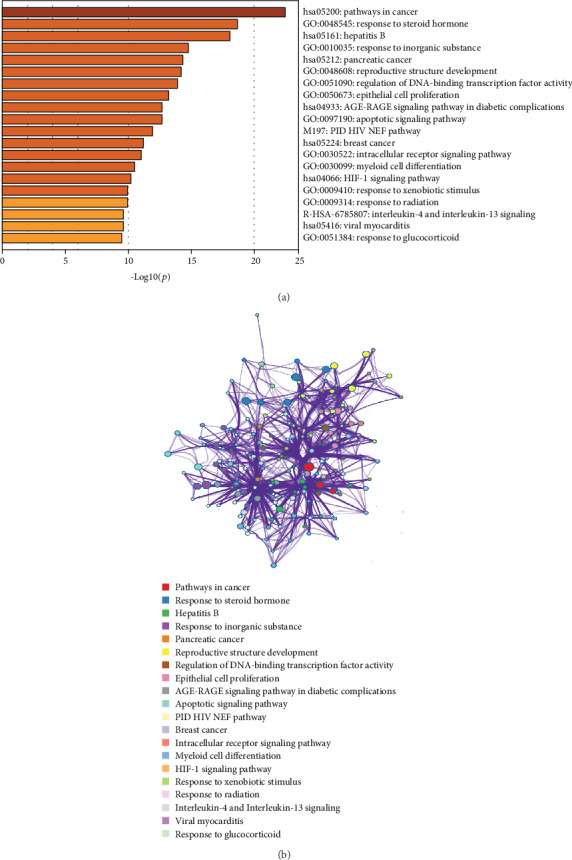
Figure 6.

GO and KEGG analyses of the 26 hub genes. (a) Bar graph of the enriched terms across input gene lists coloured according to p values: terms with a p value < 0.01, a minimum count of 3, and an enrichment factor > 1.5. (b) Network of enriched terms coloured by cluster ID, where nodes that share the same cluster ID are typically close to each other.
