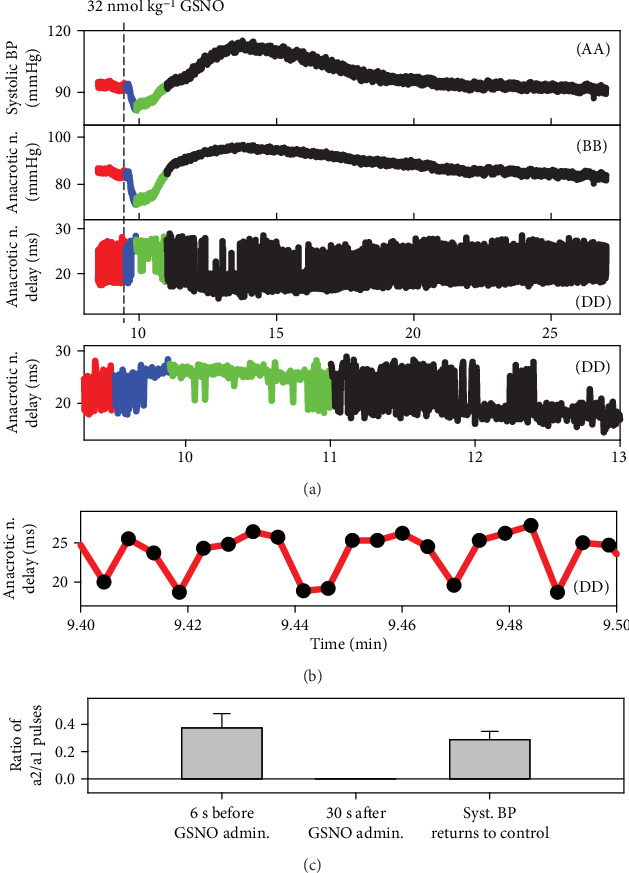
Figure 7.

Time-dependent effect of 32 nmol kg−1 GSNO on three HPs. The fluctuations of anacrotic notch delay (dd) reflect the time interval fluctuation between the a1 and a2 points (Figure 1). The higher value of anacrotic notch delay in ms (a, b) indicates that the diastolic BP at point a1 was lower than that at point a2. The fluctuation between the a1 and a2 points in pulses (black circles) recorded for 6 s before the GSNO administration (b). Comparison of the ratio of a2/a1 pulses during 6 s: 6 s before, 30 s after the GSNO administration, and at the time when systolic BP returned to the control value (c); means ± SE, n = 10.
